🔓 Get All Tools for FREE!
- ✅ Click here to open a trading account using our referral link and start trading.
- 📅 After 7 days of active trading under our referral link, you can get access to all tools in your account.
- ⚠️ Keep trading to keep access free — if you're inactive for 7 days, your access will be removed.
- 👉 Already have an account? You can change the IB (introducing broker) to our referral link ( https://one.exnesstrack.org/a/w7syl3vnjb ) and still qualify!
The Custom Moving Average Cross Strategy is one of the most widely used and effective trading strategies for both beginners and experienced traders. Moving averages are simple yet powerful indicators that help smooth out price action over a specified time frame. By utilizing two moving averages—one fast-moving average and one slow-moving average—you can generate reliable buy and sell signals based on crossovers between these two averages.
In this article, we will explore what this strategy entails, how to implement it using TradingView, and how you can optimize it to suit your trading style. Whether you trade stocks, forex, or cryptocurrencies, the Custom Moving Average Cross Strategy can be a great addition to your toolkit for identifying potential trends in the market.
What is the Custom Moving Average Cross Strategy?
At its core, the Custom Moving Average Cross Strategy involves using two moving averages with different periods. A fast-moving average has a shorter time frame and reacts more quickly to price changes, while a slow-moving average has a longer time frame and smooths out the overall trend. The key to this strategy lies in identifying the points where these two moving averages cross.
🔓 Get All Tools for FREE!
- ✅ Click here to open a trading account using our referral link and start trading.
- 📅 After 7 days of active trading under our referral link, you can get access to all tools in your account.
- ⚠️ Keep trading to keep access free — if you're inactive for 7 days, your access will be removed.
- 👉 Already have an account? You can change the IB (introducing broker) to our referral link ( https://one.exnesstrack.org/a/w7syl3vnjb ) and still qualify!
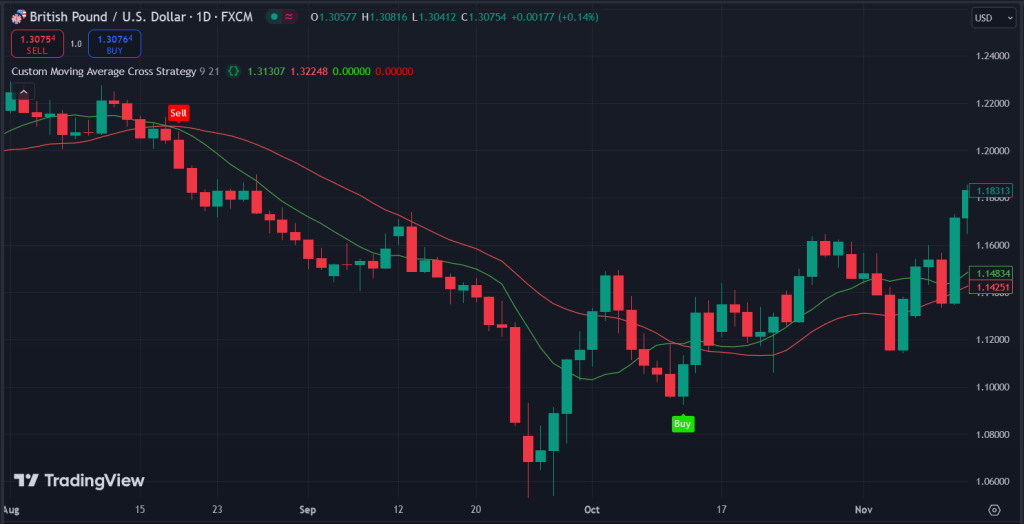
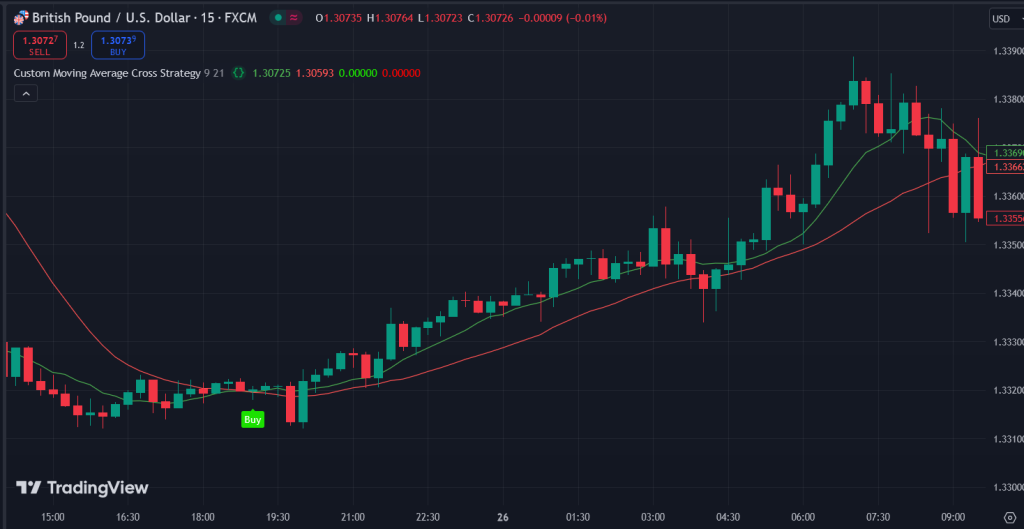
- Buy Signal: When the fast-moving average crosses above the slow-moving average, it signals that upward momentum is building, and it’s a potential buy opportunity.
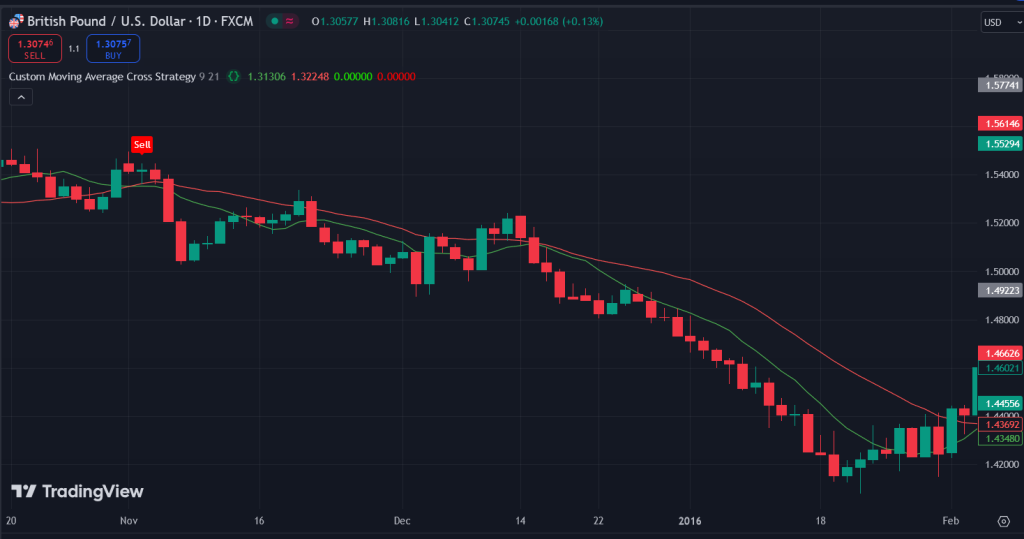
- Sell Signal: When the fast-moving average crosses below the slow-moving average, it indicates downward momentum, signaling a potential sell opportunity.
The crossover is essential because it highlights a shift in market sentiment. When the fast-moving average crosses above the slow one, it means that recent prices are higher than older ones, indicating bullish strength. On the other hand, when the fast-moving average crosses below the slow one, it suggests that recent prices are lower than past ones, signaling bearish momentum.
Why Use Moving Averages in Trading?
Moving averages are some of the most widely used technical indicators because of their simplicity and effectiveness. Here’s why they are an excellent choice for traders:
- Trend Identification: Moving averages help traders quickly identify whether the market is in an uptrend, downtrend, or consolidating. This is crucial for determining the best times to buy or sell.
- Signal Confirmation: Moving averages can serve as confirmation for other indicators or trading setups. For example, if you’re considering entering a trade based on price action, a moving average crossover can provide additional confirmation.
- Smoothing Volatility: Moving averages smooth out price fluctuations and provide a clearer picture of the market’s direction, reducing the noise caused by short-term price spikes.
- Customizability: Traders can adjust the periods of the moving averages to suit their specific strategy. For example, you might use a 50-period moving average alongside a 200-period moving average for longer-term trends, or a 9-period and 21-period moving average for shorter-term trades.
How Does the Custom Moving Average Cross Strategy Work in TradingView?
TradingView provides traders with excellent tools for charting and implementing the Custom Moving Average Cross Strategy. Follow these steps to set it up and use it on the TradingView platform:
1. Set Two Moving Averages
- On your TradingView chart, add two moving averages.
- Set one moving average to a shorter period (e.g., 9 or 20), which will be your fast-moving average.
- Set the second moving average to a longer period (e.g., 50 or 200), which will be your slow-moving average.
2. Buy Signal
- A buy signal is generated when the fast-moving average crosses above the slow-moving average.
- This crossover indicates that recent prices are higher than previous prices, signaling a potential uptrend.
3. Sell Signal
- A sell signal occurs when the fast-moving average crosses below the slow-moving average.
- This suggests that recent prices are lower than past prices, signaling a potential downtrend.
4. Customization
- You can further customize the periods and types of moving averages to suit your trading strategy. For instance, you can use Exponential Moving Averages (EMAs) for a more sensitive approach or stick with Simple Moving Averages (SMAs) for a smoother experience.
5. Risk Management
- No strategy is foolproof, and the Custom Moving Average Cross Strategy is no exception. It’s essential to use proper risk management, such as placing stop-loss orders at key levels to minimize potential losses if the trade goes against you.
Optimizing the Custom Moving Average Cross Strategy
While the basic strategy of using two moving averages is simple and effective, there are several ways you can enhance it to improve your trading results:
1. Combine with Other Indicators
While moving average crossovers are great at identifying trends, they can sometimes generate false signals in choppy or ranging markets. To filter out these false signals, consider combining the Custom Moving Average Cross Strategy with other technical indicators such as:
- Relative Strength Index (RSI): The RSI can help identify overbought or oversold conditions, allowing you to time your entries and exits better.
- Volume Indicators: High volume during a crossover increases the validity of the signal, while low volume may suggest the move lacks strength.
2. Adjust the Time Frames
Depending on your trading style, you may want to adjust the periods of the moving averages. For example:
- Short-Term Traders: If you’re a day trader or swing trader, you may prefer to use a 9-period and 21-period moving average to capture short-term price movements.
- Long-Term Traders: For longer-term trading, such as position trading, you might use a 50-period and 200-period moving average, which is commonly used to identify larger market trends.
3. Backtest the Strategy
One of the best features of TradingView is its ability to backtest strategies. Before applying the Custom Moving Average Cross Strategy in live markets, it’s a good idea to backtest it on historical data to see how it performs. You can do this by applying the moving averages to past price data and analyzing how effective the crossover signals were.
4. Fine-Tune with Alerts
TradingView allows you to set custom alerts for moving average crossovers. This way, you don’t have to constantly monitor the chart. Once a crossover occurs, you’ll be notified, helping you execute trades in a timely manner.
Risk Management and Considerations
Like any trading strategy, the Custom Moving Average Cross Strategy comes with its own set of risks. The strategy may work well in trending markets but can generate false signals in sideways or choppy markets. To manage these risks, consider the following:
- Stop-Loss Orders: Always use stop-loss orders to protect your capital. Place your stop-loss below a significant support level for buy trades and above a resistance level for sell trades.
- Position Sizing: Risk only a small percentage of your capital on any single trade (e.g., 1-2%) to ensure you don’t wipe out your account with a few bad trades.
- Market Conditions: Be aware that moving averages tend to lag behind price. This can sometimes lead to late entries or exits, especially in volatile markets. Combine this strategy with other market analysis methods for better results.
Pinescript code for "Custom Moving Average Cross Strategy"

//@version=5
// insta id algo_aakash
indicator("Custom Moving Average Cross Strategy", overlay=true)

// Input parameters for custom moving averages
fastLength = input.int(9, title="Fast MA Length")
slowLength = input.int(21, title="Slow MA Length")

// Calculate moving averages
fastMA = ta.sma(close, fastLength)
slowMA = ta.sma(close, slowLength)

// Plot the moving averages
plot(fastMA, color=color.green, title="Fast MA")
plot(slowMA, color=color.red, title="Slow MA")

// Generate buy and sell signals
buySignal = ta.crossover(fastMA, slowMA)
sellSignal = ta.crossunder(fastMA, slowMA)

// Plot buy and sell signals on the chart
plotshape(buySignal, style=shape.labelup, location=location.belowbar, color=#1be100, size=size.tiny, title='Buy', text='Buy', textcolor=color.white)
plotshape(sellSignal, style=shape.labeldown, location=location.abovebar, color=#fc0000, size=size.tiny, title='Sell', text='Sell', textcolor=color.white)

// Add alerts for buy and sell signals
alertcondition(buySignal, title="Buy Alert", message="Buy Signal: Fast MA crossed above Slow MA")
alertcondition(sellSignal, title="Sell Alert", message="Sell Signal: Fast MA crossed below Slow MA")
Conclusion
The Custom Moving Average Cross Strategy is a highly effective way to identify trends and generate trading signals in various markets. By using two moving averages with different periods, traders can easily spot potential buy and sell opportunities based on crossovers. However, it’s essential to combine this strategy with proper risk management techniques and consider using other indicators to filter out false signals.
Disclaimer:
The information provided in this article is for educational and informational purposes only. It is not intended to be investment advice, financial advice, or any other type of advice. Trading involves risk, and you should never trade with money you cannot afford to lose. Always conduct your own research and consult with a licensed financial advisor or professional before making any trading decisions. Past performance is not indicative of future results. The strategies discussed in this article may not be suitable for all traders, and the results may vary based on individual circumstances.
0 Comments