In the dynamic world of trading, utilizing technical indicators is crucial for making informed decisions. One of the most powerful combinations is the Relative Strength Index (RSI) paired with a Moving Average overlay. This combination helps traders refine their strategies, identify trends, and make better trade entries and exits. In this article, we will explore how to implement the RSI with a Moving Average overlay on TradingView, detailing its functionality, benefits, and practical applications in trading.

What is the indicator?
The Relative Strength Index (RSI) is a momentum oscillator that measures the speed and change of price movements. Developed by J. Welles Wilder, the RSI ranges from 0 to 100 and is typically used to identify overbought and oversold conditions in the market. Generally, an RSI above 70 indicates that an asset may be overbought, while an RSI below 30 suggests it may be oversold.
However, the RSI can often be volatile and choppy, leading to potential false signals. For instance, during a strong trending market, the RSI may remain in the overbought or oversold territory for extended periods, making it difficult for traders to gauge the market’s true strength. To address these challenges, many traders choose to overlay a Moving Average on the RSI, which helps smooth out the oscillator and provide clearer signals.

The Power of Moving Averages
A Moving Average (MA) is a commonly used indicator that helps traders identify the direction of the trend by smoothing price data over a specified period. The two main types of moving averages are Simple Moving Averages (SMA) and Exponential Moving Averages (EMA). In our script, we use a Simple Moving Average of the RSI to reduce noise and improve signal clarity.
When you overlay a Moving Average on the RSI, it allows you to visualize the average momentum over a defined period (default is 9 in the script). This helps traders better understand the strength of price movements and make more informed decisions.
How to Implement the RSI with Moving Average Overlay in TradingView
To get started with the RSI and Moving Average overlay in TradingView:
- Access the Pine Script Editor: In TradingView, navigate to the Pine Script editor at the bottom of the chart.
- Add the Script: Insert a custom script for the RSI with Moving Average Overlay to create the indicator.
- Customize Inputs: Adjust the RSI length (default is 14) and the Moving Average length (default is 9) to match your trading style.
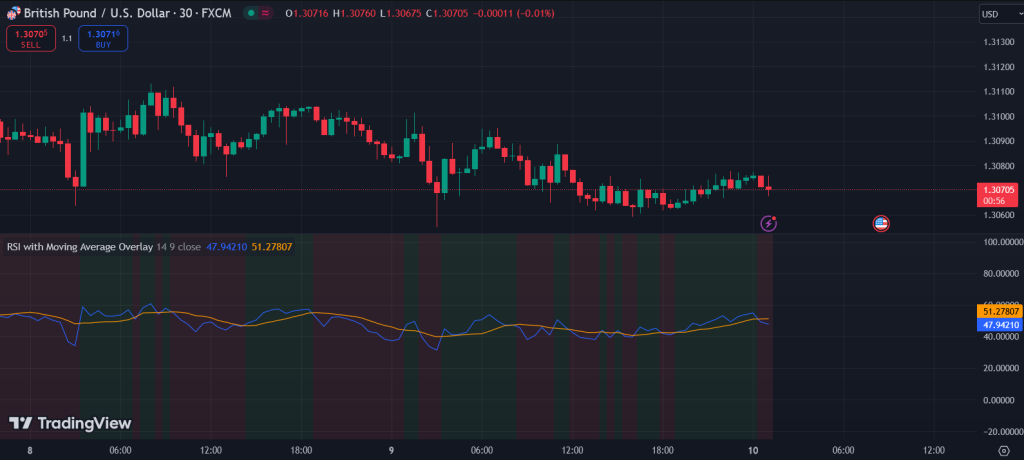
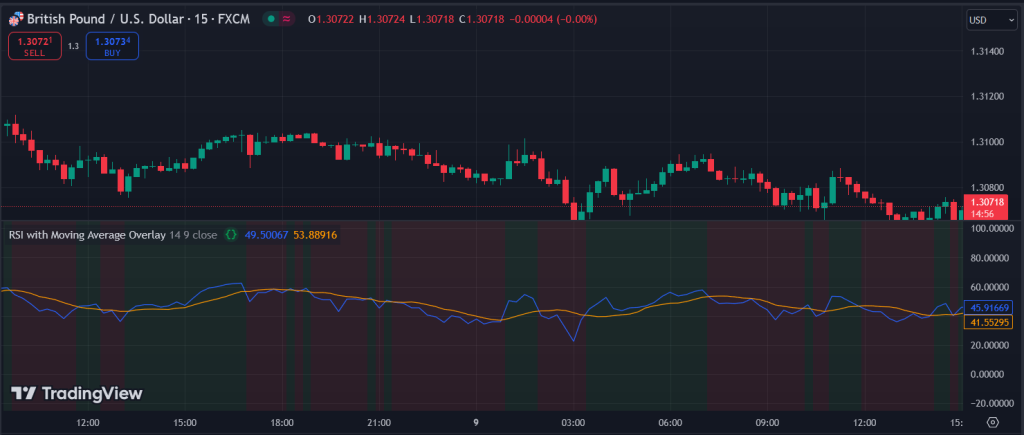
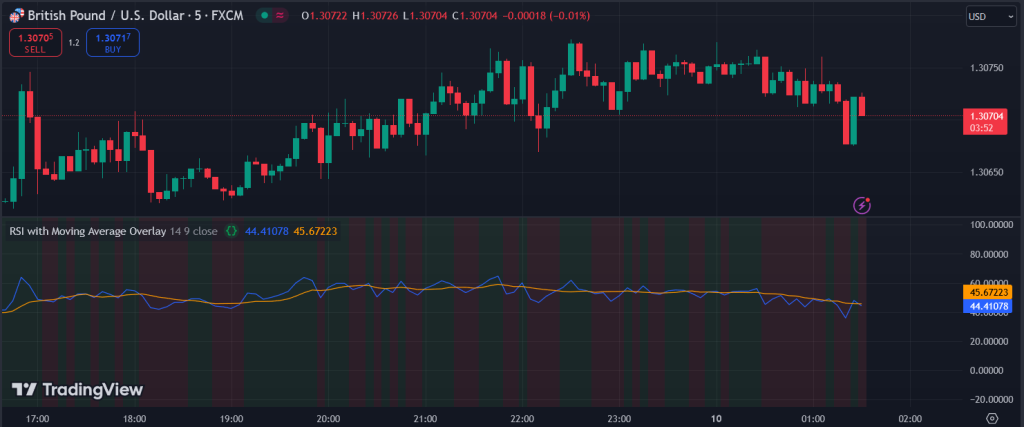
- Apply to Chart: Once applied, the RSI will be plotted in blue, and the Moving Average of the RSI in orange. The background color will change based on the trend (green for uptrends, red for downtrends).
Interpreting Signals from the RSI with Moving Average Overlay
Trend Confirmation
One of the primary uses of the RSI with a Moving Average is trend confirmation. When the RSI is above the Moving Average, it indicates bullish momentum, while a position below the Moving Average suggests bearish momentum. Traders can use this information to align their trades with the prevailing market trend, increasing the likelihood of success.
Signal Strength
The crossover of the RSI and Moving Average can serve as a valuable trading signal. When the RSI crosses above the Moving Average, it can indicate a potential buying opportunity, as this suggests a shift to bullish momentum. Conversely, when the RSI crosses below the Moving Average, it may signal a selling opportunity, indicating a shift to bearish momentum.
Optional Buy/Sell Signals
In the provided script, you have the option to include visual buy and sell signals based on the crossover conditions. When the RSI crosses above the Moving Average, a green “BUY” label appears below the bar, while a red “SELL” label appears above the bar when the RSI crosses below. These signals enhance the visual representation of potential trade opportunities, making it easier for traders to react quickly to market changes.

Pinescript code for "RSI with Moving Average Overlay "

//@version=5
indicator("RSI with Moving Average Overlay", overlay=false)

// Input settings
rsiLength = input.int(14, title="RSI Length")
maLength = input.int(9, title="Moving Average Length")
src = input(close, title="Source")

// Calculate RSI
rsi = ta.rsi(src, rsiLength)

// Calculate Moving Average of RSI
maRsi = ta.sma(rsi, maLength)

// Plot RSI and Moving Average
plot(rsi, color=color.blue, title="RSI")
plot(maRsi, color=color.orange, title="RSI Moving Average")

// Plot background color for trend confirmation
bgcolor(rsi > maRsi ? color.new(color.green, 90) : color.new(color.red, 90), title="Trend Background")

// // Add crossover conditions for buy/sell signals optional
// plotshape(series=ta.cross(rsi, maRsi) and rsi > maRsi, title="Buy Signal", location=location.belowbar, color=color.green, style=shape.labelup, text="BUY")
// plotshape(series=ta.cross(rsi, maRsi) and rsi < maRsi, title="Sell Signal", location=location.abovebar, color=color.red, style=shape.labeldown, text="SELL")

Conclusion
The RSI with Moving Average overlay is a powerful combination that enhances trading strategies by providing clearer trend signals and reducing noise. By implementing this indicator in TradingView, traders can effectively identify market trends, confirm entry and exit points, and make more informed decisions. Whether you are a beginner or an experienced trader, adding the RSI with a Moving Average overlay to your toolkit can significantly improve your trading performance.
Disclaimer
The content provided in this article is for informational and educational purposes only and does not constitute financial advice. Trading involves significant risks, and it is essential to conduct thorough research and consult with a qualified financial advisor before making any trading decisions. The strategies and indicators discussed may not be suitable for all investors. Past performance is not indicative of future results, and you should only trade with capital that you can afford to lose. Always consider your financial situation and risk tolerance when engaging in trading activities.

0 Comments