🔓 Get All Tools for FREE!
- ✅ Click here to open a trading account using our referral link and start trading.
- 📅 After 7 days of active trading under our referral link, you can get access to all tools in your account.
- ⚠️ Keep trading to keep access free — if you're inactive for 7 days, your access will be removed.
- 👉 Already have an account? You can change the IB (introducing broker) to our referral link ( https://one.exnesstrack.org/a/w7syl3vnjb ) and still qualify!
In the world of technical analysis, traders rely on various tools and indicators to help them make informed decisions. One such tool is the VWAP (Volume Weighted Average Price) Bands Reversal Indicator, a custom-built script in TradingView that combines the power of VWAP with statistical bands to identify potential reversal points in price movements. This indicator is particularly helpful for traders looking to capitalize on market reversals for more precise entries and exits.
This article dives deep into how the VWAP Bands Reversal Indicator works, why it is valuable for traders, and how it can be used effectively within TradingView charts.
What is the VWAP Bands Reversal Indicator?
The VWAP Bands Reversal Indicator is designed to assist traders in identifying potential buy and sell signals based on the interaction between price and VWAP bands. The script calculates VWAP—a widely-used indicator in technical analysis that reflects the average price of a security, adjusted for its trading volume—and adds upper and lower bands around the VWAP line.
🔓 Get All Tools for FREE!
- ✅ Click here to open a trading account using our referral link and start trading.
- 📅 After 7 days of active trading under our referral link, you can get access to all tools in your account.
- ⚠️ Keep trading to keep access free — if you're inactive for 7 days, your access will be removed.
- 👉 Already have an account? You can change the IB (introducing broker) to our referral link ( https://one.exnesstrack.org/a/w7syl3vnjb ) and still qualify!
These bands are calculated using the standard deviation of the closing price over a specified period (20 bars by default) and a multiplier (set to 1.5 by default). The upper and lower bands serve as dynamic support and resistance levels, helping traders spot overbought or oversold conditions that could lead to price reversals.
In essence, when the price crosses below the lower band, the indicator generates a buy signal, suggesting that the price may have dropped too far and could soon reverse upward. Conversely, when the price crosses above the upper band, the indicator generates a sell signal, indicating that the price may have risen too far and could soon decline.
Understanding the Key Components of the VWAP Bands Reversal Indicator
1. VWAP (Volume Weighted Average Price)
VWAP is one of the most commonly used indicators in intraday trading. It represents the average price at which a security has traded throughout the day, adjusted for its volume. VWAP helps traders determine whether the price is trading above or below its average value for the session, which can give them insights into the overall market sentiment.
- Above VWAP: If the price is above the VWAP line, it indicates a bullish market sentiment, as buyers are willing to pay more than the average price.
- Below VWAP: If the price is below VWAP, it suggests bearish sentiment, as sellers are dominant and the price is trending below the average.
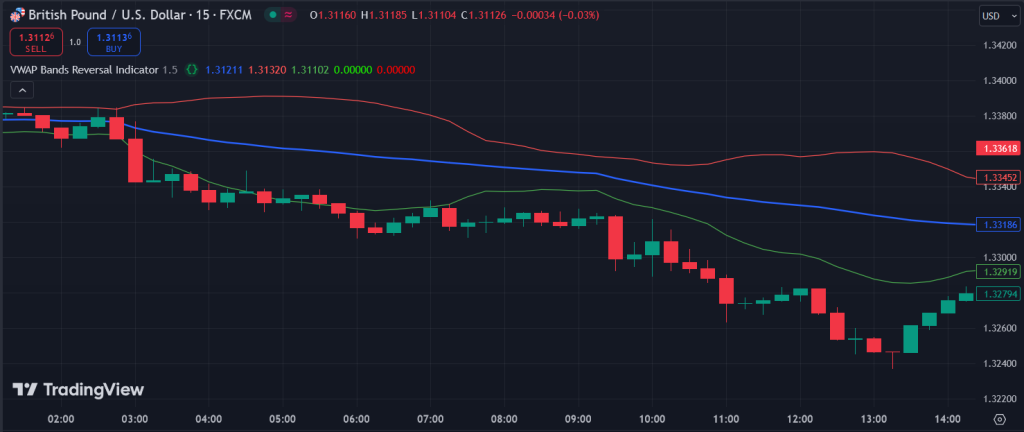
In the VWAP Bands Reversal Indicator, VWAP is plotted in blue to help traders easily identify this crucial price level.
2. Standard Deviation and Bands
The upper and lower bands are created by applying a statistical standard deviation to the closing prices over a 20-period window. The bands act as dynamic resistance and support levels, with the upper band being a potential zone of overbought conditions and the lower band indicating oversold conditions.
- Upper Band: This is plotted in red and is calculated as the VWAP value plus the standard deviation times the multiplier (default: 1.5). When the price crosses this band from below, it could signal a sell opportunity, indicating a potential price reversal.
- Lower Band: This is plotted in green and represents VWAP minus the standard deviation times the multiplier. A crossover of the price from above this lower band generates a buy signal, hinting that the market might be oversold and due for a bounce.
3. Buy and Sell Signals
The indicator generates reversal signals based on the interaction between the price and these VWAP bands.
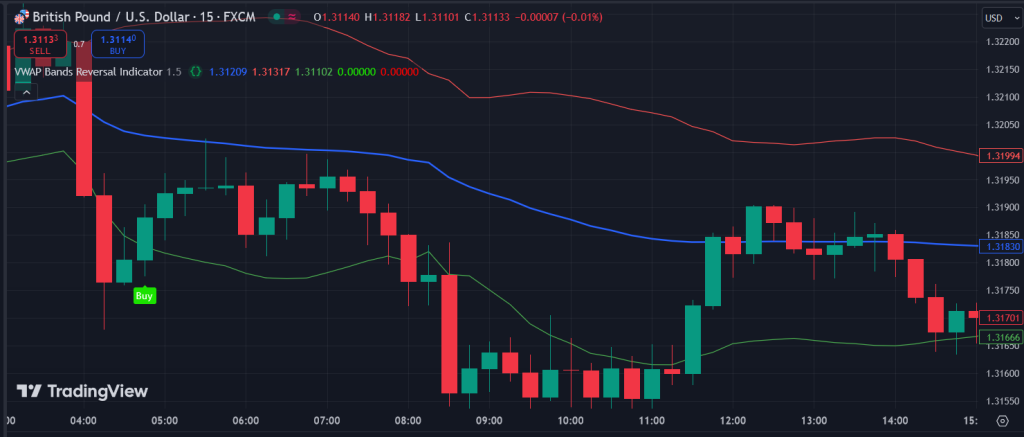
- Buy Signal: A buy signal is triggered when the price crosses from above the lower band to below it. This crossover indicates that the price may have reached an oversold level, and a reversal could be imminent. A green “Buy” label appears below the bar where the crossover occurs, helping traders spot potential long positions.
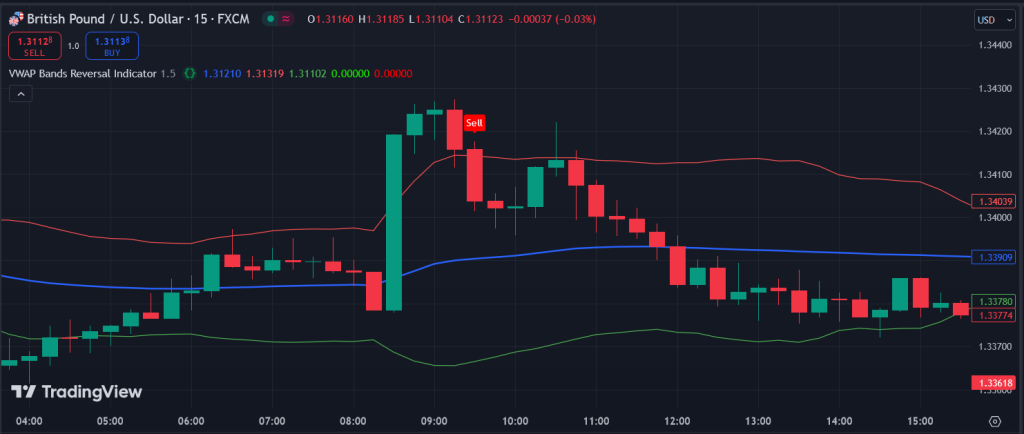
- Sell Signal: A sell signal is triggered when the price crosses from below the upper band to above it. This crossover suggests that the market might be overbought, and a downward reversal is likely. A red “Sell” label appears above the bar where the crossover takes place, signaling a potential short position.
How the VWAP Bands Reversal Indicator Works in TradingView Charts
Using the VWAP Bands Reversal Indicator in TradingView is straightforward, and its visual cues make it an intuitive tool for identifying market reversals. Here’s how it works, step by step:
- VWAP and Bands Display:
- The VWAP line is plotted in blue on the chart.
- The upper band is plotted in red, acting as potential resistance.
- The lower band is plotted in green, acting as potential support.
- Generating Buy Signals:
When the price crosses below the green lower band, the indicator displays a green “Buy” label below the price bar. This label suggests that the market may be oversold, and a reversal to the upside could be expected. - Generating Sell Signals:
When the price crosses above the red upper band, the indicator displays a red “Sell” label above the price bar. This label indicates potential overbought conditions and suggests that the price may soon reverse downward. - Alerts for Buy and Sell Signals:
The script also includes automated alerts. Traders can set up alerts that trigger notifications when the price hits either the upper or lower band, ensuring that they never miss a reversal signal.
Benefits of Using the VWAP Bands Reversal Indicator
The VWAP Bands Reversal Indicator offers several advantages for traders who want to improve their reversal trading strategies:
- Clear Visual Cues: The colored bands and labels make it easy for traders to spot potential reversal points on the chart without needing to second-guess their decisions.
- Dynamic Support and Resistance: Unlike fixed levels, the VWAP bands adjust to the price’s volatility, providing more accurate signals.
- Volume Sensitivity: Since the VWAP is volume-weighted, the indicator is inherently more sensitive to significant market moves driven by volume, making it ideal for intraday and swing traders.
- Custom Alerts: With built-in alerts, traders can automate their strategy and stay on top of market moves, even when they’re away from their screens.
Pinescript code for "VWAP Bands Reversal Indicator"

//@version=5
//insta id algo_akash
indicator("VWAP Bands Reversal Indicator", overlay=true)

// VWAP calculation
vwapValue = ta.vwap(close)

// Band Multiplier Inputs
multiplier = input.float(1.5, title="Band Multiplier")

// VWAP Bands calculation
upperBand = vwapValue + ta.stdev(close, 20) * multiplier
lowerBand = vwapValue - ta.stdev(close, 20) * multiplier

// Plot VWAP and Bands
plot(vwapValue, color=color.blue, linewidth=2, title="VWAP")
plot(upperBand, color=color.red, linewidth=1, title="Upper Band")
plot(lowerBand, color=color.green, linewidth=1, title="Lower Band")

// Define Variables to Track Signals
var bool lastBuy = na
var bool lastSell = na

// Reversal Signals
buySignal = ta.crossover(close, lowerBand) and (na(lastSell) or lastSell)
sellSignal = ta.crossunder(close, upperBand) and (na(lastBuy) or lastBuy)

// Update Last Signals
if (buySignal)
    lastBuy := true
    lastSell := false

if (sellSignal)
    lastSell := true
    lastBuy := false


// Plot Buy/Sell Signals
plotshape(buySignal, style=shape.labelup, location=location.belowbar, color=#1be100, size=size.tiny, title='Buy', text='Buy', textcolor=color.white)
plotshape( sellSignal, style=shape.labeldown, location=location.abovebar, color=#fc0000, size=size.tiny, title='Sell', text='Sell', textcolor=color.white)

// Alert Conditions
alertcondition(buySignal, title="Buy Signal", message="Price hit the lower band. Potential Buy!")
alertcondition(sellSignal, title="Sell Signal", message="Price hit the upper band. Potential Sell!")
Conclusion: Why You Should Consider the VWAP Bands Reversal Indicator
The VWAP Bands Reversal Indicator is a powerful tool for traders looking to capture market reversals with accuracy. By combining VWAP with statistically calculated bands, this indicator provides dynamic support and resistance levels, helping traders make informed buy and sell decisions. Whether you’re a day trader or a swing trader, this indicator’s simplicity, visual clarity, and flexibility make it a valuable addition to your trading toolkit.
Disclaimer:
While the VWAP Bands Reversal Indicator may assist in identifying potential buy and sell signals, there is no guarantee of success or profitability. Users are encouraged to conduct their own research, consider their financial situation, and consult with a qualified financial advisor before making any trading or investment decisions.

0 Comments