🔓 Get All Tools for FREE!
- ✅ Click here to open a trading account using our referral link and start trading.
- 📅 After 7 days of active trading under our referral link, you can get access to all tools in your account.
- ⚠️ Keep trading to keep access free — if you're inactive for 7 days, your access will be removed.
- 👉 Already have an account? You can change the IB (introducing broker) to our referral link ( https://one.exnesstrack.org/a/w7syl3vnjb ) and still qualify!
In today’s fast-paced financial markets, traders are always on the lookout for innovative tools that can give them an edge. One such powerful tool is the Multi-Timeframe RSI (Relative Strength Index) indicator. This custom indicator integrates RSI values from different timeframes into one chart, giving traders a more comprehensive view of market momentum and helping them make better trading decisions. In this article, we will explore what the Multi-Timeframe RSI indicator is, how it works, and why it’s an essential tool for traders of all levels.
What is the Multi-Timeframe RSI Indicator?
The Relative Strength Index (RSI) is a widely used momentum oscillator that measures the speed and change of price movements. Traditionally, RSI helps traders identify overbought or oversold conditions, signaling potential reversals or shifts in market direction. It does this by calculating the ratio of recent gains to losses over a specific period, producing a value between 0 and 100.
A standard RSI value above 70 typically indicates that an asset is overbought, while a value below 30 suggests it is oversold. However, analyzing RSI from a single timeframe often falls short when trying to grasp the broader market picture. That’s where the Multi-Timeframe RSI indicator comes into play.
🔓 Get All Tools for FREE!
- ✅ Click here to open a trading account using our referral link and start trading.
- 📅 After 7 days of active trading under our referral link, you can get access to all tools in your account.
- ⚠️ Keep trading to keep access free — if you're inactive for 7 days, your access will be removed.
- 👉 Already have an account? You can change the IB (introducing broker) to our referral link ( https://one.exnesstrack.org/a/w7syl3vnjb ) and still qualify!
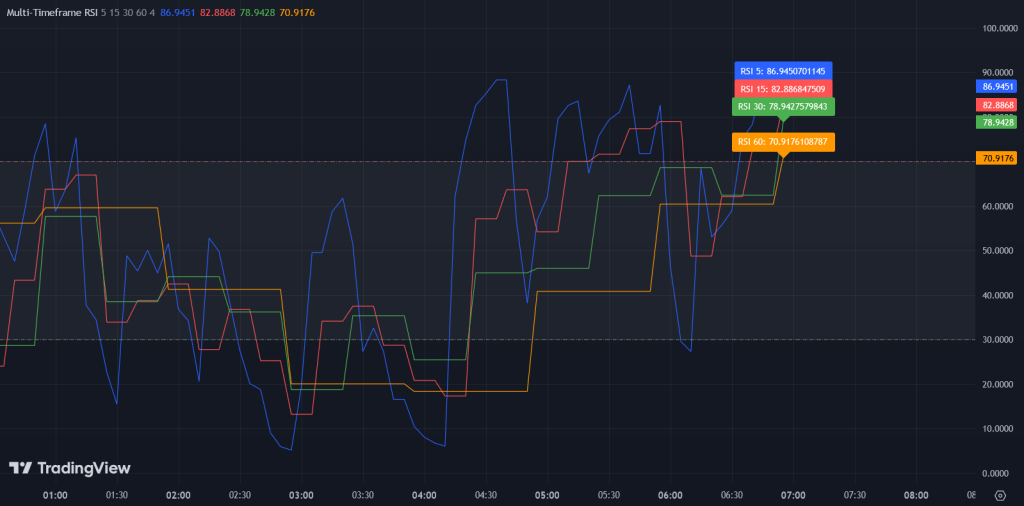
The Multi-Timeframe RSI indicator enhances the traditional RSI by integrating readings from multiple timeframes, such as the 5-minute, 1-hour, and daily charts, onto a single screen. This multi-layered view allows traders to see how momentum aligns or diverges across different timeframes, providing a clearer understanding of market conditions. By analyzing RSI values from different periods together, traders can make more informed decisions about market trends and reversals.
Why Use the Multi-Timeframe RSI Indicator?
- Better Trend Identification: A single timeframe RSI may show an overbought condition, while the longer timeframe RSI may indicate the market is still trending strongly. The Multi-Timeframe RSI eliminates this potential confusion by showing how RSI behaves across different timeframes, helping traders avoid false signals and better understand market momentum.
- Informed Decision-Making: By observing how different timeframes interact, traders can identify when short-term and long-term signals converge or diverge. This gives traders a more comprehensive view, allowing them to anticipate stronger price movements or potential reversals more accurately.
- Customization: The Multi-Timeframe RSI indicator can be customized to match different trading styles, whether you’re a day trader, swing trader, or long-term investor. You can choose which timeframes to focus on based on your strategy, making it a highly flexible tool.
- Improved Entry and Exit Points: The alignment of RSI values from multiple timeframes can provide clearer signals for entering or exiting trades. When multiple timeframes indicate an overbought or oversold condition, it can offer stronger confirmation for a trade decision.
How the Multi-Timeframe RSI Indicator Works
Using the Multi-Timeframe RSI on TradingView or other charting platforms is straightforward. Here’s a step-by-step breakdown of how it works:
1. Add the Indicator
To get started, simply open your charting platform, like TradingView, and search for the Multi-Timeframe RSI in the indicator list. Select it and apply it to your chart. You can adjust the default timeframes or use the preset ones to get an overview of the RSI across multiple periods.
2. View Multiple Timeframes
Once the indicator is applied, you’ll see RSI values from various timeframes—such as 5-minute, 1-hour, and daily—overlaid on a single chart. This enables you to view the momentum across short-term, medium-term, and long-term timeframes all at once.
3. Analyze Signals
Now that you have multiple timeframes displayed, you can start analyzing the signals. For example:
- If RSI values are high (above 70) across multiple timeframes, it signals that the market may be overbought, suggesting a possible price correction or reversal.
- If RSI values are low (below 30) across multiple timeframes, it indicates oversold conditions, pointing to a potential buying opportunity.
- If the shorter-term RSI shows a strong move but the longer-term RSI remains neutral, it may suggest that the momentum shift is temporary.
4. Customize Settings
The beauty of this indicator is its flexibility. Depending on your trading strategy, you can customize the timeframes and RSI parameters to suit your needs. For example, a day trader might focus on 1-minute, 5-minute, and 15-minute RSIs, while a swing trader might prefer the 1-hour, 4-hour, and daily timeframes.
5. Utilize for Trading Decisions
Finally, use the insights gained from the Multi-Timeframe RSI to make better trading decisions. If RSI values align across different timeframes, it suggests stronger confirmation of market momentum. You can use this alignment to time your entries and exits more effectively, improving your trading success.
Real-World Example of Multi-Timeframe RSI in Action
Let’s say you’re analyzing a stock using the Multi-Timeframe RSI. On the 5-minute chart, RSI shows an overbought condition (above 70), signaling a potential short-term price pullback. However, when you check the 1-hour and daily timeframes, RSI remains neutral, indicating that the overall trend is still strong. In this case, the short-term signal may be misleading, and waiting for a better alignment across timeframes might prevent a premature exit from a profitable position.
On the other hand, if both the 5-minute and 1-hour RSIs show overbought conditions while the daily RSI is approaching overbought levels, it may signal a more significant price correction ahead. This alignment can provide stronger confidence to exit a long position or enter a short trade.
Benefits of Multi-Timeframe RSI for Different Trading Styles
1. Day Traders
Day traders benefit from the Multi-Timeframe RSI by gaining real-time insights into market momentum. They can quickly identify when shorter-term trends align with longer-term signals, helping them capture quick price movements and optimize their entry and exit points.
2. Swing Traders
Swing traders often look for multi-day price swings, and the Multi-Timeframe RSI helps them identify these swings by providing a broader view of momentum across several timeframes. By analyzing how RSI behaves on the 1-hour, 4-hour, and daily charts, swing traders can spot the best times to enter or exit positions.
3. Long-Term Investors
Even long-term investors can benefit from the Multi-Timeframe RSI by using it to confirm entry and exit points for longer-term positions. By observing how RSI aligns across weekly and daily timeframes, they can gain confidence in holding or adjusting positions based on broader market momentum.
Pinescript code of "Multi-Timeframe RSI Indicator"

//@version=5
indicator("Multi-Timeframe RSI", overlay=false)

// Input for timeframes
timeframe1 = input.timeframe("5", title="Timeframe 1")
timeframe2 = input.timeframe("15", title="Timeframe 2")
timeframe3 = input.timeframe("30", title="Timeframe 3")
timeframe4 = input.timeframe("60", title="Timeframe 4")

// Input for RSI length
rsiLength = input.int(14, title="RSI Length", minval=1)

// Calculate RSI for different timeframes
rsi1 = request.security(syminfo.tickerid, timeframe1, ta.rsi(close, rsiLength))
rsi2 = request.security(syminfo.tickerid, timeframe2, ta.rsi(close, rsiLength))
rsi3 = request.security(syminfo.tickerid, timeframe3, ta.rsi(close, rsiLength))
rsi4 = request.security(syminfo.tickerid, timeframe4, ta.rsi(close, rsiLength))

// Plotting the RSI values
plot(rsi1, color=color.blue, title="RSI + timeframe1" )
plot(rsi2, color=color.red, title="RSI + timeframe2" )
plot(rsi3, color=color.green, title="RSI + timeframe3" )
plot(rsi4, color=color.orange, title="RSI + timeframe4" )

// Add horizontal lines for overbought and oversold levels
hline(70, "Overbought", color=color.red, linestyle=hline.style_dotted)
hline(30, "Oversold", color=color.green, linestyle=hline.style_dotted)

// Fill area between overbought and oversold levels
fill(hline(70), hline(30), color=color.new(color.gray, 90), title="RSI Range Fill")

// Display label indicating the values of RSIs for each timeframe
var label lbl1 = na
var label lbl2 = na
var label lbl3 = na
var label lbl4 = na

if (bar_index == 0)
    lbl1 := label.new(bar_index, rsi1, text="RSI " + timeframe1 + ": " + str.tostring(rsi1), color=color.blue, textcolor=color.white, style=label.style_label_down)
    lbl2 := label.new(bar_index, rsi2, text="RSI " + timeframe2 + ": " + str.tostring(rsi2), color=color.red, textcolor=color.white, style=label.style_label_down)
    lbl3 := label.new(bar_index, rsi3, text="RSI " + timeframe3 + ": " + str.tostring(rsi3), color=color.green, textcolor=color.white, style=label.style_label_down)
    lbl4 := label.new(bar_index, rsi4, text="RSI " + timeframe4 + ": " + str.tostring(rsi4), color=color.orange, textcolor=color.white, style=label.style_label_down)
else
    label.set_xy(lbl1, bar_index, rsi1)
    label.set_text(lbl1, "RSI " + timeframe1 + ": " + str.tostring(rsi1))
    label.set_xy(lbl2, bar_index, rsi2)
    label.set_text(lbl2, "RSI " + timeframe2 + ": " + str.tostring(rsi2))
    label.set_xy(lbl3, bar_index, rsi3)
    label.set_text(lbl3, "RSI " + timeframe3 + ": " + str.tostring(rsi3))
    label.set_xy(lbl4, bar_index, rsi4)
    label.set_text(lbl4, "RSI " + timeframe4 + ": " + str.tostring(rsi4))
Conclusion
The Multi-Timeframe RSI indicator is a powerful tool that enhances traditional RSI analysis by offering a comprehensive view of market momentum across different timeframes. Whether you’re a day trader, swing trader, or long-term investor, this indicator helps you make better-informed decisions, identify stronger trends, and improve your entry and exit strategies. By customizing the timeframes and settings to match your trading style, you can gain valuable insights that may otherwise go unnoticed with a single timeframe RSI.
Disclaimer:
The content provided in this article is for informational and educational purposes only. It is not financial advice and should not be interpreted as such. Trading in financial markets involves substantial risk, and individuals should consult with a professional financial advisor or conduct thorough research before making any investment decisions. The use of the Multi-Timeframe RSI indicator, or any other technical tool, does not guarantee profits and may lead to financial loss. Past performance is not indicative of future results. Always trade responsibly and within your risk tolerance.

0 Comments