🔓 Get All Tools for FREE!
- ✅ Click here to open a trading account using our referral link and start trading.
- 📅 After 7 days of active trading under our referral link, you can get access to all tools in your account.
- ⚠️ Keep trading to keep access free — if you're inactive for 7 days, your access will be removed.
- 👉 Already have an account? You can change the IB (introducing broker) to our referral link ( https://one.exnesstrack.org/a/w7syl3vnjb ) and still qualify!
Momentum analysis plays a critical role in successful trading, offering insights into the strength and sustainability of a trend. One of the most popular tools used by traders to gauge momentum and spot trend reversals is the Moving Average Convergence Divergence (MACD) indicator. However, the Color-Coded MACD Momentum Indicator is a customized and enhanced version of the traditional MACD that offers better visualization through color-coded trends and arrows, making it easier for traders to detect key signals and react promptly.
In this article, we’ll dive deep into how the Color-Coded MACD Momentum Indicator works, its components, and how it enhances momentum analysis to aid in making more informed trading decisions.
Understanding the Basics of MACD
Before we delve into the Color-Coded MACD Momentum Indicator, it’s important to understand the fundamentals of the MACD itself. The MACD is a popular technical indicator used to measure momentum and identify potential trend reversals. It does so by calculating the difference between two moving averages – typically, the 12-day (fast) and 26-day (slow) exponential moving averages (EMAs).
🔓 Get All Tools for FREE!
- ✅ Click here to open a trading account using our referral link and start trading.
- 📅 After 7 days of active trading under our referral link, you can get access to all tools in your account.
- ⚠️ Keep trading to keep access free — if you're inactive for 7 days, your access will be removed.
- 👉 Already have an account? You can change the IB (introducing broker) to our referral link ( https://one.exnesstrack.org/a/w7syl3vnjb ) and still qualify!
The core components of a traditional MACD indicator include:
- MACD Line: This line represents the difference between the fast and slow moving averages. It moves above or below zero, providing insights into market momentum.
- Signal Line: A smoothed 9-day EMA of the MACD line, used as a trigger for buy and sell signals.
- Histogram: The difference between the MACD line and the signal line is represented as bars (histogram). Positive bars indicate bullish momentum, while negative bars show bearish momentum.
What Sets the Color-Coded MACD Momentum Indicator Apart?
While the traditional MACD is powerful, the Color-Coded MACD Momentum Indicator introduces additional features that make it more visually intuitive and easier to interpret for traders.
Here are the key elements of the Color-Coded MACD Momentum Indicator:
- MACD Calculation: Like the traditional MACD, the Color-Coded version calculates the difference between the fast and slow EMAs to derive the MACD line. However, the customization comes into play through visual enhancements that offer a better grasp of momentum shifts.
- Signal Line: A smoothed signal line, usually the 9-day EMA of the MACD, is plotted on the chart for easy cross-referencing. This line helps to smooth out the fluctuations and offers a clearer trend direction, aiding traders in decision-making.
- Color-Coded Histogram: The unique aspect of this indicator lies in its color-coded histogram. Instead of a single color, the histogram changes colors to represent shifts in momentum.
- When the MACD histogram crosses above the zero line, it turns green, indicating a bullish momentum shift.
- When it crosses below the zero line, it turns red, signaling a bearish momentum shift.
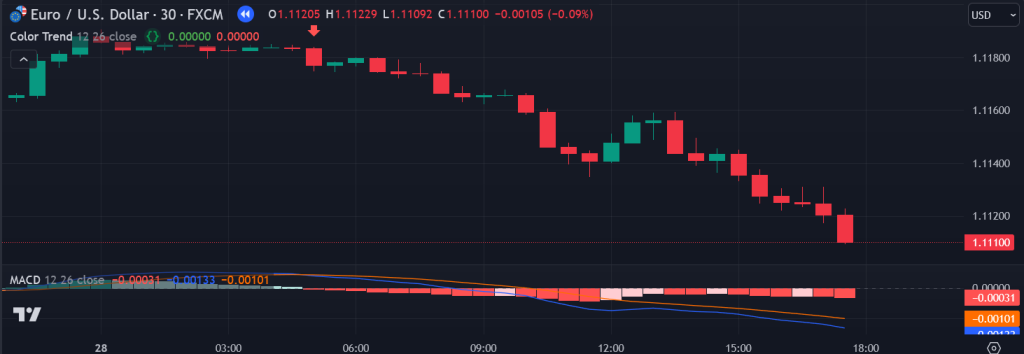
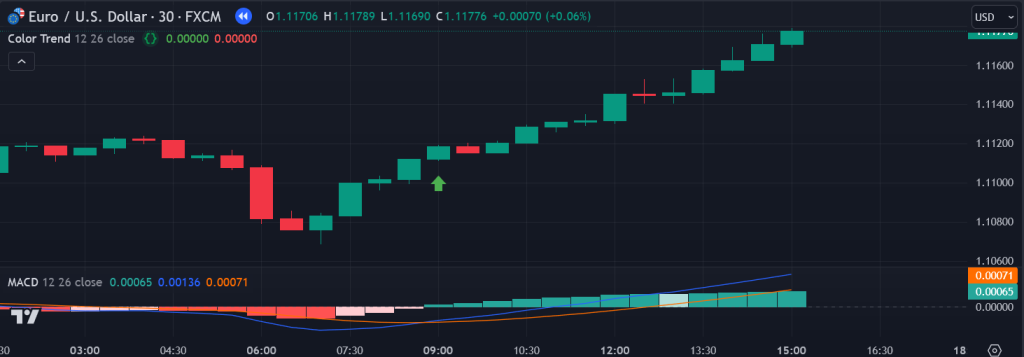
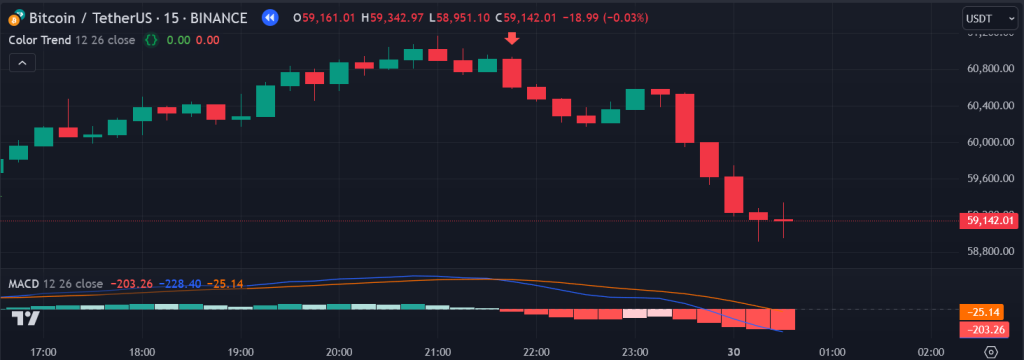
- Arrows for Visual Signals: To further enhance usability, the Color-Coded MACD Momentum Indicator plots arrows directly on the chart when the histogram crosses the zero line.
- A green arrow is plotted when the momentum turns bullish, i.e., when the histogram crosses from negative to positive.
- A red arrow is plotted when the momentum turns bearish, i.e., when the histogram crosses from positive to negative.
These arrows serve as clear visual indicators of potential trend shifts, making it easier for traders to spot changes in momentum without having to scrutinize the chart too closely.
How the Color-Coded MACD Momentum Indicator Works
Now that we’ve covered the key components, let’s break down how this customized indicator works in real-time trading scenarios:
- MACD Calculation: The indicator calculates the difference between the 12-day EMA (fast) and the 26-day EMA (slow). This difference forms the MACD line.
- Signal Line: A 9-day EMA of the MACD line is plotted as the signal line, which helps to smooth out the noise and provides a reference point for when momentum is shifting.
- Histogram and Color-Coding: The difference between the MACD line and the signal line is displayed as a histogram. When the MACD crosses the signal line from below, the histogram turns green, indicating a potential uptrend. When the MACD crosses the signal line from above, the histogram turns red, signaling a possible downtrend. The color-coded histogram makes it easy to see these changes at a glance.
- Arrows for Clear Entry and Exit Signals: The arrows provide a visual representation of key trading signals:
- A green arrow indicates that the momentum has turned bullish and can serve as a signal to enter a long (buy) position.
- A red arrow indicates that the momentum has turned bearish and can be used as a signal to enter a short (sell) position or exit a long trade.
These arrows are especially useful for traders who prefer visual cues over interpreting numbers and chart patterns.
- Alert Conditions: Another added benefit is the alert system. The indicator can generate alerts when the histogram changes direction, notifying traders of potential trend reversals. This is particularly useful for those who want to be proactive in their trades but don’t have the time to constantly monitor their charts.
Why Traders Use the Color-Coded MACD Momentum Indicator
The Color-Coded MACD Momentum Indicator offers several advantages over the traditional MACD, making it a popular choice among swing traders and day traders alike.
- Improved Visualization: The use of colors and arrows makes it easy to spot bullish and bearish momentum shifts. This enhanced visualization reduces the cognitive load on traders, helping them make quicker decisions without having to manually analyze each chart.
- Clearer Entry and Exit Signals: The arrows plotted directly on the chart provide traders with clear signals for entering and exiting trades. This can be especially useful in volatile markets, where timing is critical.
- Alert System: Traders can set up alerts to notify them when the histogram changes direction, allowing them to react quickly to potential trend reversals. This feature is particularly useful for traders who want to stay on top of market movements without constant chart-watching.
- Adaptable Across Markets: Like the traditional MACD, the Color-Coded MACD Momentum Indicator can be applied to a wide variety of markets, including stocks, forex, commodities, and cryptocurrencies.
Pinescript code of Color-Coded MACD Momentum Indicator

//@version=5
// insta id algo_aakash
indicator(title="Color-Coded MACD Momentum Indicator", shorttitle="Color Trend", overlay = true, timeframe="", timeframe_gaps=true)

// Getting inputs
fast_length = input(title = "Fast Length", defval = 12)
slow_length = input(title = "Slow Length", defval = 26)
src = input(title = "Source", defval = close)
signal_length = input.int(title = "Signal Smoothing",  minval = 1, maxval = 50, defval = 9, display = display.data_window)
sma_source = input.string(title = "Oscillator MA Type",  defval = "EMA", options = ["SMA", "EMA"], display = display.data_window)
sma_signal = input.string(title = "Signal Line MA Type", defval = "EMA", options = ["SMA", "EMA"], display = display.data_window)

// Calculating
fast_ma = sma_source == "SMA" ? ta.sma(src, fast_length) : ta.ema(src, fast_length)
slow_ma = sma_source == "SMA" ? ta.sma(src, slow_length) : ta.ema(src, slow_length)
macd = fast_ma - slow_ma
signal = sma_signal == "SMA" ? ta.sma(macd, signal_length) : ta.ema(macd, signal_length)
hist = macd - signal

// Alert conditions
alertcondition(hist[1] >= 0 and hist < 0, title = 'Rising to falling', message = 'The MACD histogram switched from a rising to falling state')
alertcondition(hist[1] <= 0 and hist > 0, title = 'Falling to rising', message = 'The MACD histogram switched from a falling to rising state')

// Arrows Logic:
// - If the histogram crosses from negative to positive, plot a green arrow below the bar.
// - If the histogram crosses from positive to negative, plot a red arrow above the bar.

plotshape(hist > 0 and hist[1] <= 0, title="Up Arrow", location=location.belowbar, color=color.green, style=shape.arrowup, size=size.auto)
plotshape(hist < 0 and hist[1] >= 0, title="Down Arrow", location=location.abovebar, color=color.red, style=shape.arrowdown, size=size.auto)
Conclusion
The Color-Coded MACD Momentum Indicator takes the power of the traditional MACD and enhances it with intuitive visual features like color-coded histograms and arrows that make it easier to spot momentum shifts. By providing clearer entry and exit signals, this indicator can help traders make more informed decisions and capitalize on market trends. Whether you’re a day trader looking for short-term opportunities or a swing trader seeking to catch longer-term moves, this customized version of the MACD is a valuable tool for your trading arsenal.
Disclaimer:
The information provided in this article is for educational and informational purposes only and should not be considered financial or investment advice. Trading and investing in financial markets involve risk, and you should be aware of these risks before making any decisions. The Color-Coded MACD Momentum Indicator is a tool that can help traders, but no indicator guarantees success or eliminates risk. Always do your own research and consult with a licensed financial advisor before making any trading or investment decisions. Past performance is not indicative of future results.
0 Comments