🔓 Get All Tools for FREE!
- ✅ Click here to open a trading account using our referral link and start trading.
- 📅 After 7 days of active trading under our referral link, you can get access to all tools in your account.
- ⚠️ Keep trading to keep access free — if you're inactive for 7 days, your access will be removed.
- 👉 Already have an account? You can change the IB (introducing broker) to our referral link ( https://one.exnesstrack.org/a/w7syl3vnjb ) and still qualify!
In the ever-volatile world of financial markets, traders are constantly seeking tools that provide clearer insights into price movements and trends. One such tool that has proven invaluable is the Moving Average, particularly the Exponential Moving Average (EMA). But what if you could visualize trends from different timeframes simultaneously on a single chart? That’s exactly what a Multi-Timeframe Moving Average Indicator allows you to do.
In this article, we will explore the mechanics, advantages, and strategies behind using a custom Multi-Timeframe EMA Indicator in TradingView, which plots EMAs for 15-minute, 1-hour, and daily timeframes on one chart. By understanding how to utilize this tool, you can enhance your trading decisions by seamlessly comparing short-term, mid-term, and long-term trends.
What is a Moving Average (MA)?
A Moving Average (MA) is a widely used technical analysis tool that smooths out price data over a specific period to create a single flowing line. The purpose of using an MA is to reduce “noise” from random short-term price fluctuations. There are two common types of moving averages: Simple Moving Average (SMA) and Exponential Moving Average (EMA).
🔓 Get All Tools for FREE!
- ✅ Click here to open a trading account using our referral link and start trading.
- 📅 After 7 days of active trading under our referral link, you can get access to all tools in your account.
- ⚠️ Keep trading to keep access free — if you're inactive for 7 days, your access will be removed.
- 👉 Already have an account? You can change the IB (introducing broker) to our referral link ( https://one.exnesstrack.org/a/w7syl3vnjb ) and still qualify!
While the SMA gives equal weighting to all data points, the EMA places more weight on recent prices, making it more responsive to new information. This is why many traders prefer EMAs for their speed in adapting to recent market movements.
Why Use Multiple Timeframes?
Traders often face a dilemma when choosing which timeframe to focus on. Should they use shorter timeframes to catch quick trend reversals, or rely on longer timeframes to gauge broader market trends? The truth is, both perspectives matter. A shorter timeframe might show minor fluctuations that don’t align with the overall trend seen on a higher timeframe. By using multiple timeframes, traders can see the bigger picture while also getting granular details.
The Multi-Timeframe EMA Indicator: What It Does
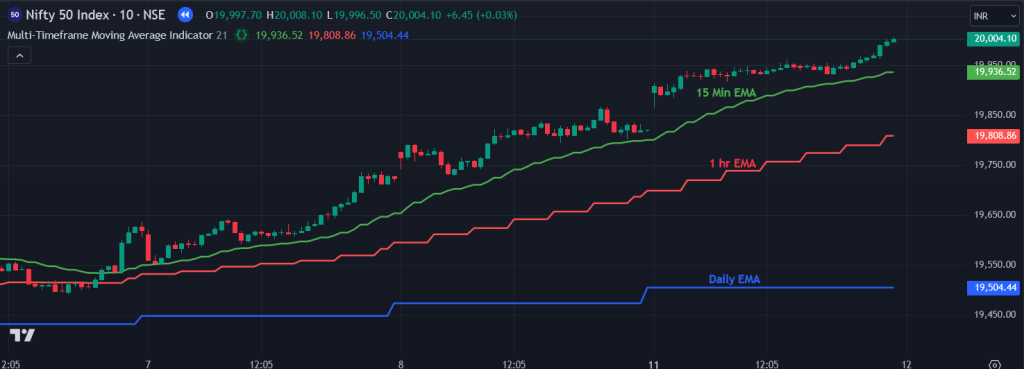
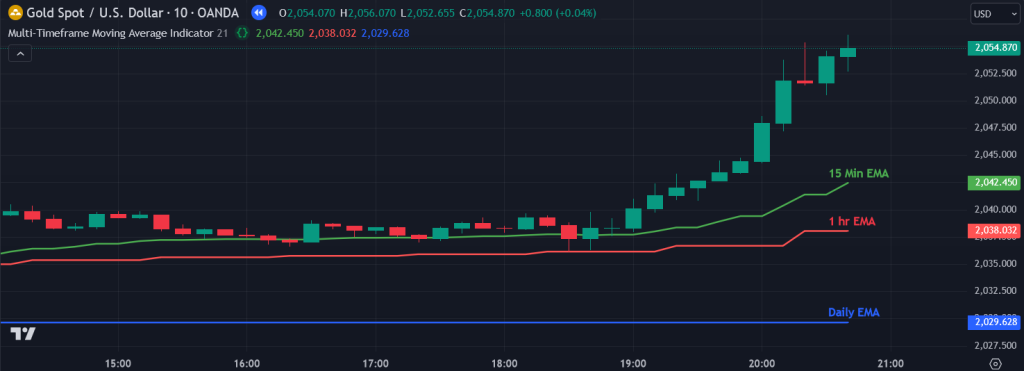
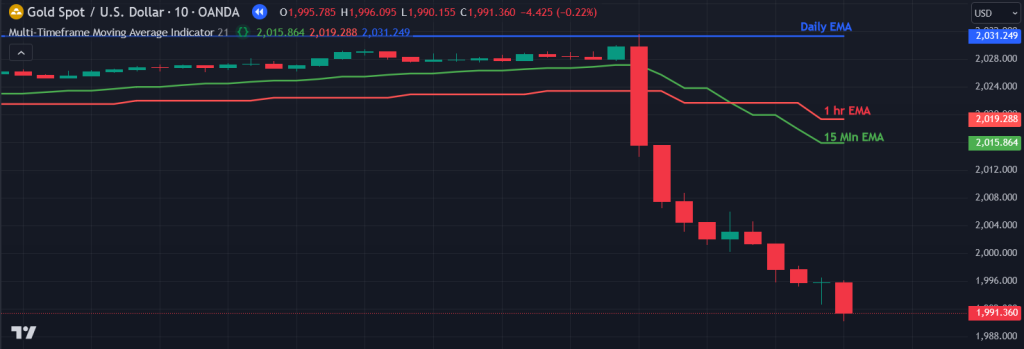
The Multi-Timeframe Moving Average Indicator uses EMAs from different timeframes to create a comprehensive view of market trends. This Pine Script calculates and plots EMAs for a 15-minute, 1-hour, and daily timeframe—all on one chart.
Each EMA is color-coded for easy differentiation:
- Green for the 15-minute EMA (short-term trend)
- Red for the 1-hour EMA (mid-term trend)
- Blue for the daily EMA (long-term trend)
The result? A seamless way to compare short-term price movements with the broader market direction, helping traders identify when different timeframes align or diverge, which can signal potential trade opportunities.

How the Multi-Timeframe EMA Indicator Works
- 15-Minute EMA (Green):
The green line represents the 15-minute EMA, which captures quick changes in price action. It’s most useful for short-term traders who are looking for fast entries and exits. This EMA is highly reactive to price movements and can provide early signals of potential trend changes. - 1-Hour EMA (Red):
The red line displays the 1-hour EMA, offering a mid-term view. It smooths out some of the noise seen in shorter timeframes, but remains sensitive enough to provide timely signals. Traders often use this EMA to gauge momentum shifts that may last for several hours. - Daily EMA (Blue):
The blue line represents the daily EMA, which tracks the long-term trend. This is ideal for swing and position traders who want to ensure they are trading in the direction of the broader market trend. The daily EMA is slower to react but provides a strong indication of the overall market direction.

For pinescript code of Multi-Timeframe Moving Average Indicator

//@version=5
// insta id algo_aakash
indicator("Multi-Timeframe Moving Average Indicator", overlay=true)

// Input for EMAs
length = input.int(21, title="EMA Length")

// Calculate EMAs for different timeframes
ema15m = request.security(syminfo.tickerid, "15", ta.ema(close, length))
ema1h = request.security(syminfo.tickerid, "60", ta.ema(close, length))
emaD = request.security(syminfo.tickerid, "D", ta.ema(close, length))

// Plot EMAs with different colors
plot(ema15m, color=color.green, linewidth=2, title="15min EMA")
plot(ema1h, color=color.red, linewidth=2, title="1hr EMA")
plot(emaD, color=color.blue, linewidth=2, title="Daily EMA")

Conclusion:
The Multi-Timeframe EMA Indicator is a powerful tool that gives traders the ability to see the bigger picture while also staying in tune with short-term price movements. By plotting EMAs from multiple timeframes on the same chart, traders can better understand how trends are developing across various time horizons.
Disclaimer: The information provided in this article is for educational purposes only and does not constitute financial advice. Trading involves risk, and past performance is not indicative of future results. Always conduct your own research and consider consulting a financial advisor before making investment decisions. The use of the Multi-Timeframe Moving Average Indicator does not guarantee profits and should be used in conjunction with a comprehensive trading strategy.
🔓 Get This Tool for FREE!
- ✅ Click here to open a trading account using our referral link and start trading.
- 💡 Use coupon code: FREE during checkout.
- 📅 After 7 days of active trading under our referral link, you’ll get access to this tool in your account.
- ⚠️ Keep trading to keep access free — if you're inactive for 7 days, your access will be removed.
- 👉 Already have an account? You can change the IB (introducing broker) to our referral link and still qualify!

0 Comments