🔓 Get All Tools for FREE!
- ✅ Click here to open a trading account using our referral link and start trading.
- 📅 After 7 days of active trading under our referral link, you can get access to all tools in your account.
- ⚠️ Keep trading to keep access free — if you're inactive for 7 days, your access will be removed.
- 👉 Already have an account? You can change the IB (introducing broker) to our referral link ( https://one.exnesstrack.org/a/w7syl3vnjb ) and still qualify!
TradingView is a powerful platform for traders, offering a variety of charting tools and indicators that assist in technical analysis. One of the key components of effective trading is using the right indicators to analyze market trends and predict potential movements. In this article, we will discuss how three specific indicators work—Trend Regularity Adaptive Moving Average (TRAMA), Trendlines with Breaks, and the Relative Strength Index (RSI)—and how they can be utilized together to enhance your trading strategy.
What is Adaptive Trend & Breakout with RSI Exit Indicator?
An indicator in trading is a statistical tool that traders use to analyze historical price and volume data to make predictions about future price movements. Indicators are crucial for providing insights into market trends, momentum, and potential reversals. They can help traders make informed decisions on when to enter or exit trades, thus optimizing their trading strategy.
🔓 Get All Tools for FREE!
- ✅ Click here to open a trading account using our referral link and start trading.
- 📅 After 7 days of active trading under our referral link, you can get access to all tools in your account.
- ⚠️ Keep trading to keep access free — if you're inactive for 7 days, your access will be removed.
- 👉 Already have an account? You can change the IB (introducing broker) to our referral link ( https://one.exnesstrack.org/a/w7syl3vnjb ) and still qualify!
How Adaptive Trend & Breakout with RSI Exit Indicators Work on TradingView?
TradingView offers a wide range of indicators that can be applied directly to charts to aid in market analysis. Many indicators are built using Pine Script, TradingView’s native programming language, which allows traders to create custom tools for their specific strategies. Below, we explore the functions of three essential indicators: TRAMA, Trendlines with Breaks, and RSI.
1. Trend Regularity Adaptive Moving Average (TRAMA) by LuxAlgo
Indicator Overview: The TRAMA indicator is designed to adapt to the market’s trends, offering a clear picture of the overall market direction and trend strength. By smoothing price data, TRAMA helps traders identify whether the market is trending upward, downward, or moving sideways.
How It Works: TRAMA is an adaptive moving average that adjusts based on the current market conditions. It reacts to changes in volatility and price trends, making it highly effective for detecting shifts in the market.
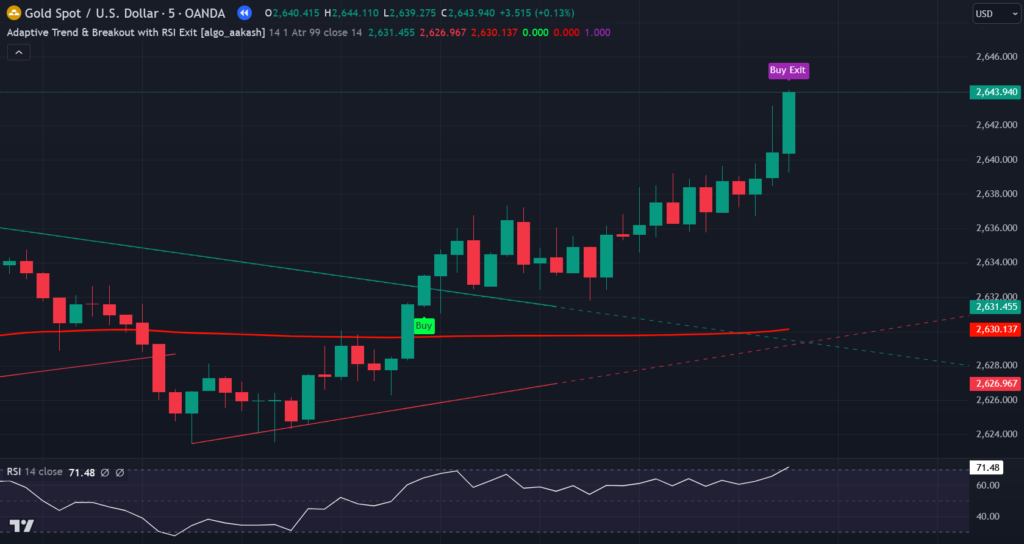
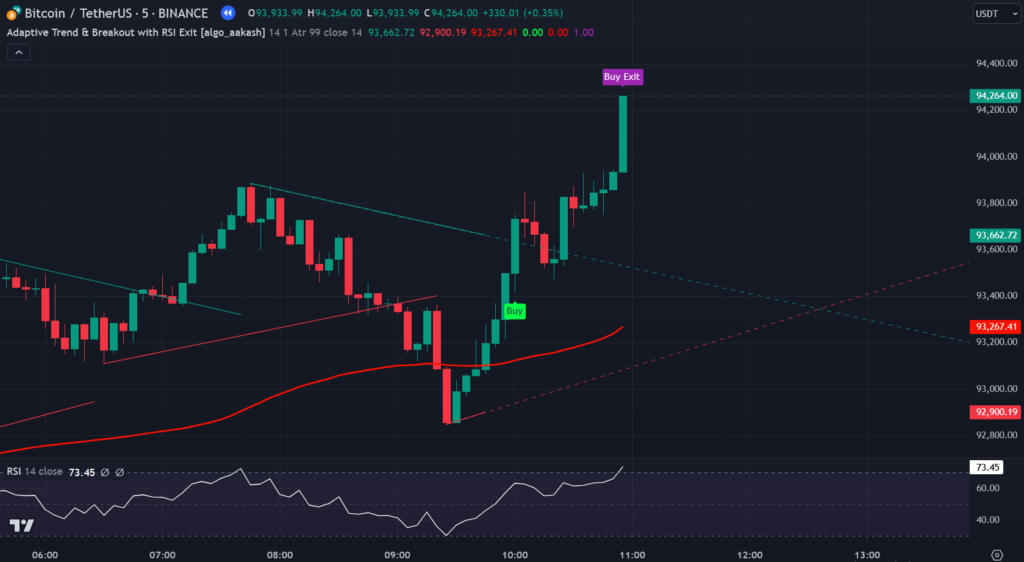
- Buy Signal Condition: When the price is above the TRAMA line, it indicates a strong bullish trend. This suggests an opportunity to consider buying, as the market is showing signs of strength in an upward direction.
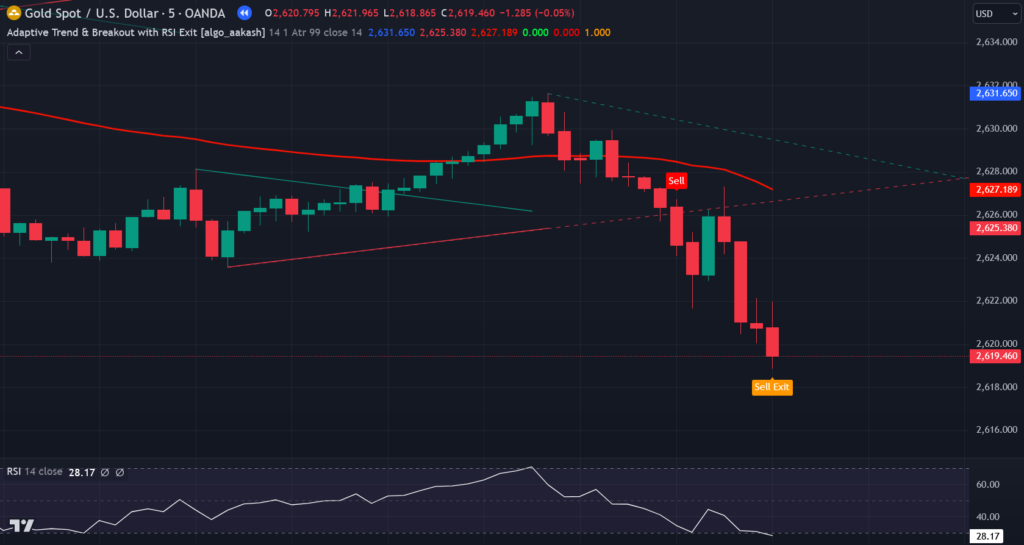
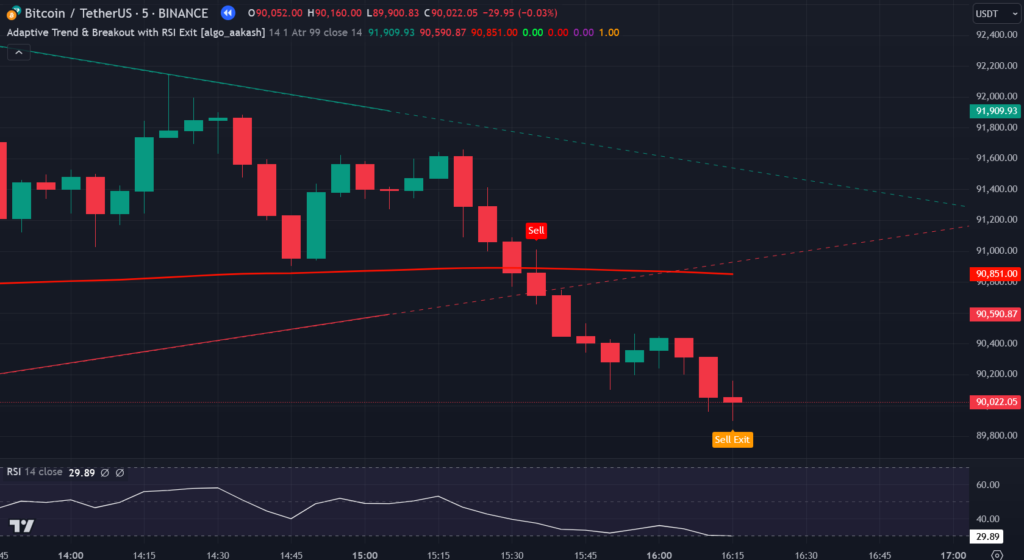
- Sell Signal Condition: Conversely, when the price is below the TRAMA line, it signals a bearish trend. This suggests a potential selling opportunity, as the market could be headed downward.
2. Trendlines with Breaks
Indicator Overview: The Trendlines with Breaks indicator automatically draws trendlines on the chart and tracks when the price breaks above or below these levels. Breakouts are often used as signals of potential trend reversals or continuation.
How It Works: The key feature of this indicator is its ability to identify price breaks above or below predefined trendlines, which are vital for determining trend shifts.
- Buy Signal Condition: A breakout above a trendline, combined with the price being above the TRAMA line, confirms that the market is likely to continue in the direction of the breakout. This strengthens the buy signal, suggesting that the upward trend is gaining momentum.
- Sell Signal Condition: When a breakout occurs below a trendline and the price is below the TRAMA line, it signals a potential downtrend, confirming the need to sell.
3. Relative Strength Index (RSI)
Indicator Overview: The Relative Strength Index (RSI) is a momentum oscillator that measures the speed and change of price movements. RSI is typically used to identify overbought or oversold conditions in the market, signaling potential reversals.
How It Works: RSI operates on a scale of 0 to 100, where readings above 70 indicate that the market is overbought (potential for a downward reversal), and readings below 30 suggest that the market is oversold (potential for an upward reversal).
- Buy Exit Condition: If the RSI is above 70, it signals that the asset may be overbought. This suggests that the price could soon reverse, making it an ideal time to exit a buy position.
- Sell Exit Condition: When the RSI drops below 30, it indicates that the asset is oversold and could soon reverse to the upside, suggesting an exit from a sell position.
How the Strategy Works Together
By combining these three indicators—TRAMA, Trendlines with Breaks, and RSI—traders can create a robust trading strategy that works well on TradingView. Below is an overview of how these indicators can be integrated to develop a comprehensive trading approach:
1. Buy Signal:
- TRAMA Confirmation: The price must be above the TRAMA line, signaling a strong bullish trend.
- Trendlines with Breaks: A breakout above a trendline reinforces the idea that the trend will continue in the upward direction.
- Strategy: This combination suggests that the market is in an uptrend, and a buy position is favorable.
2. Buy Exit:
- RSI Condition: The buy position is exited when the RSI exceeds 70, indicating that the asset is overbought and a price reversal might occur soon.
- Strategy: Exiting the buy trade ensures that the trader avoids potential losses when the market becomes overextended.
3. Sell Signal:
- TRAMA Confirmation: The price must be below the TRAMA line, signaling a bearish trend.
- Trendlines with Breaks: A breakout below a trendline further confirms the downtrend, signaling that the market will likely continue lower.
- Strategy: The combination of these conditions suggests that it is an ideal time to enter a sell trade.
4. Sell Exit:
- RSI Condition: The sell position is exited when the RSI drops below 30, suggesting that the asset is oversold and a reversal to the upside is possible.
- Strategy: Exiting the sell trade ensures that the trader does not hold onto a position when the market is poised for a rebound.
Why This Strategy Works
This strategy combines the strengths of three well-known indicators:
- TRAMA helps detect the overall market trend, ensuring that trades are entered in the direction of the prevailing trend.
- Trendlines with Breaks act as confirmation tools, signaling when the market is likely to break out in a specific direction.
- RSI provides valuable insights into overbought or oversold conditions, allowing traders to exit trades at optimal points.
The synergy between these indicators increases the probability of successful trades by aligning trend direction, breakout confirmation, and overbought/oversold conditions. By using these indicators together on TradingView, traders can develop a reliable, data-driven strategy that maximizes their chances of profitability.
Conclusion
Incorporating the TRAMA, Trendlines with Breaks, and RSI indicators into a cohesive trading strategy on TradingView can significantly enhance the effectiveness of your trades. These indicators work synergistically to provide trend confirmation, breakout analysis, and overbought/oversold signals. By understanding how these indicators work and applying them in your trading plan, you can better navigate market movements and make informed decisions. Whether you’re using Pine Script to customize your strategies or relying on built-in tools, TradingView offers everything you need to optimize your trading experience.
Pinescript of Adaptive Trend & Breakout with RSI Exit Indicator
For access to this indicator, contact us at +91 7620658346. We specialize in creating custom algorithms for TradingView, MT4/MT5, and trading bots.
Stay updated by following @algo_aakash on Instagram, YouTube, and Twitter.
Disclaimer
The information provided in this article and any associated indicators is for educational purposes only. Trading financial markets involves significant risk, and there are no guarantees of profit. Adaptive Trend & Breakout with RSI Exit Indicator, which may not predict future market movements. Users should conduct their own research, assess their risk tolerance, and consult with a licensed financial advisor before making any trading decisions. The author and developer of this indicator are not liable for any losses incurred from its use. Please trade responsibly.
0 Comments