🔓 Get All Tools for FREE!
- ✅ Click here to open a trading account using our referral link and start trading.
- 📅 After 7 days of active trading under our referral link, you can get access to all tools in your account.
- ⚠️ Keep trading to keep access free — if you're inactive for 7 days, your access will be removed.
- 👉 Already have an account? You can change the IB (introducing broker) to our referral link ( https://one.exnesstrack.org/a/w7syl3vnjb ) and still qualify!
In the world of technical analysis, indicators are essential tools that help traders make informed decisions. With platforms like TradingView and the powerful scripting language Pine Script, creating custom indicators that align with a specific trading strategy is easier than ever. In this article, we will delve into a custom indicator that automates Buy and Sell signals along with key levels such as Entry, Stop Loss (SL), and Take Profit (TP). Let’s explore how this indicator works, how to set it up on TradingView, and how it can help you optimize your trading strategy.
What is EMA 50 Breakout & Pullback Indicator
This custom indicator is designed to simplify the trading process by automatically plotting critical information on the chart, including Buy and Sell signals, along with Entry, Stop Loss (SL), and Take Profit (TP) levels. The primary strategy behind the indicator is based on the price action, moving averages, and swing highs/lows. It incorporates dynamic risk management through the use of the Chandelier Stop and ensures a 1:2 risk-to-reward ratio for each trade.
🔓 Get All Tools for FREE!
- ✅ Click here to open a trading account using our referral link and start trading.
- 📅 After 7 days of active trading under our referral link, you can get access to all tools in your account.
- ⚠️ Keep trading to keep access free — if you're inactive for 7 days, your access will be removed.
- 👉 Already have an account? You can change the IB (introducing broker) to our referral link ( https://one.exnesstrack.org/a/w7syl3vnjb ) and still qualify!
How the EMA 50 Breakout & Pullback Indicator Works on Tradingview
The indicator operates on the following conditions and logic, creating a seamless experience for traders. It is programmed using Pine Script on TradingView to automatically track price movements, trend changes, and swing points.
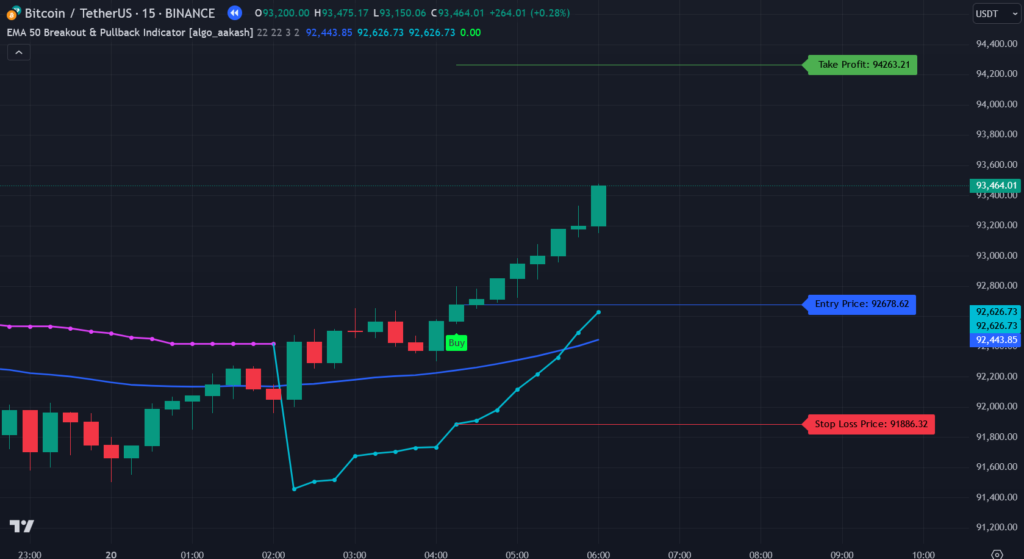
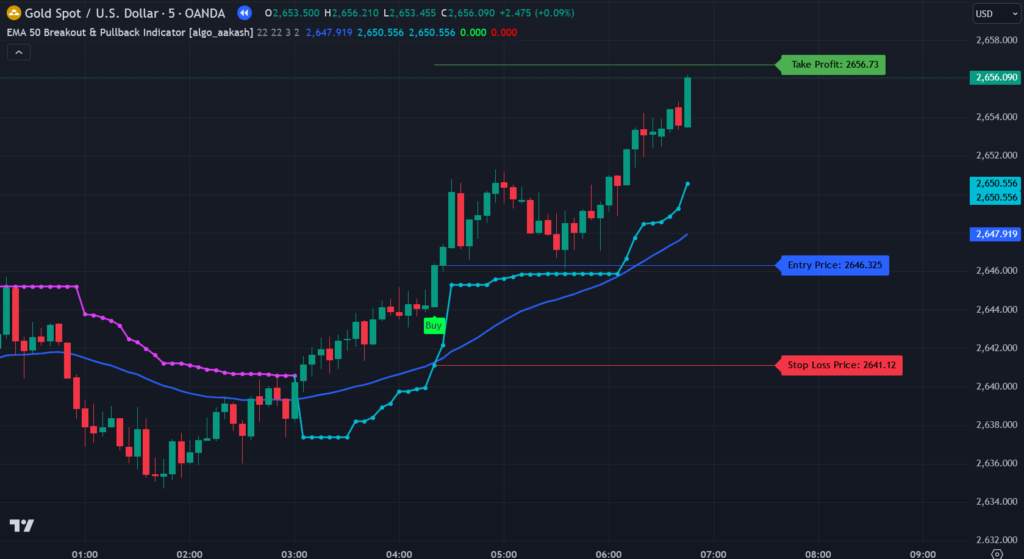
1. Buy Signal
A Buy signal is triggered when the following conditions are met:
- Condition 1 (EMA 50 Breakout): The indicator checks if the price breaks above the 50-period Exponential Moving Average (EMA). This breakout suggests that the market is entering an uptrend, and a potential buy opportunity is forming.
- Condition 2 (Pullback Confirmation): After the breakout, the indicator looks for a pullback, confirmed by two consecutive red candles. This pullback ensures that the market is retracing and not in a false breakout, providing a safer entry point for the uptrend continuation.
- Condition 3 (Swing High Marked): The highest point during the pullback is identified as the swing high, which will act as a reference for the breakout.
- Condition 4 (Swing High Break): Once the price breaks above this swing high, the indicator plots a Buy Signal and draws the Entry Line.
- Stop Loss (SL): The Stop Loss is automatically calculated using the Chandelier Stop method, which adjusts based on market volatility. It is placed below the swing low to protect against a larger-than-expected price move.
- Take Profit (TP): The Take Profit is set at twice the distance of the Stop Loss, ensuring a favorable 1:2 risk-to-reward ratio. This setup helps traders maximize their profit potential while managing risk.
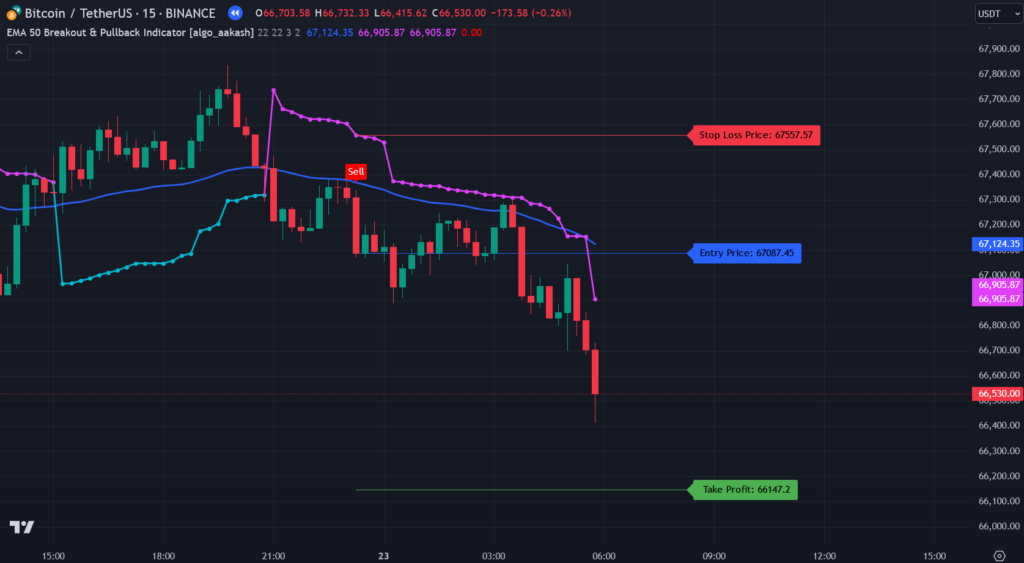
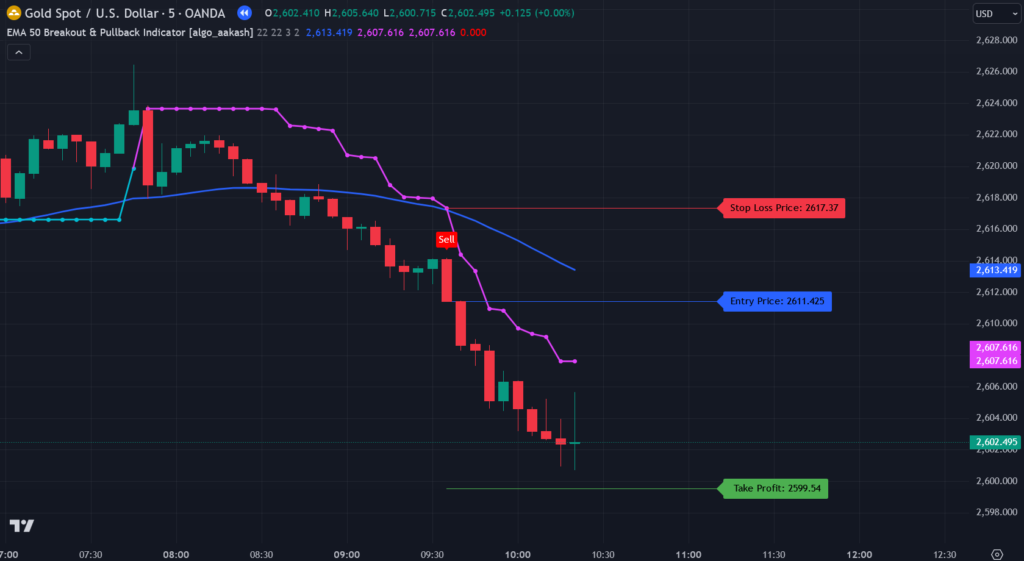
2. Sell Signal
Conversely, the Sell signal is triggered by the following conditions:
- Condition 1 (EMA 50 Breakdown): When the price breaks below the 50-period EMA, the indicator recognizes a potential downtrend and prepares to trigger a Sell signal.
- Condition 2 (Pullback Confirmation): After the breakdown, two consecutive green candles are identified as a pullback. This indicates that the market is retracing upward before resuming its downward movement.
- Condition 3 (Swing Low Marked): The lowest point during the pullback is identified as the swing low.
- Condition 4 (Swing Low Break): When the price breaks below the swing low, the indicator triggers a Sell signal and marks the Entry Line.
- Stop Loss (SL): The Stop Loss is calculated using the Chandelier Stop method, positioned above the swing high to protect against upward price movement.
- Take Profit (TP): As with the Buy signal, the Take Profit is set at twice the distance of the Stop Loss for a 1:2 risk-to-reward ratio.
Setup Invalidations
While the indicator is highly effective, it includes mechanisms to ensure that invalid setups are avoided:
- EMA 50 Violation (For Both Buy and Sell): If the price moves back across the EMA 50 (below the EMA 50 for Buy signals or above the EMA 50 for Sell signals), the indicator invalidates the current setup. This ensures that only valid signals are acted upon.
- Large Break of Swing High/Low (For Both Buy and Sell): If the candle that breaks the swing high or low is significantly larger (3-4 times the average size) than the typical candle, the indicator disregards the signal, preventing potential false breakouts from influencing the trade.
How to Use the Indicator on TradingView
Using this custom indicator on TradingView is simple, and the process is straightforward for any trader familiar with Pine Script.
- Access the TradingView Chart: Log in to your TradingView account, and select the chart for the asset you wish to trade.
- Add the Custom Indicator: Open the Pine Script editor and paste the code for the custom indicator. Once saved, add it to your chart.
- Look for Buy and Sell Signals: When the indicator triggers a Buy or Sell signal, you will see clear Entry, Stop Loss, and Take Profit lines plotted on the chart. These lines will automatically adjust as the market moves, providing real-time risk management.
- Manage the Trade: You can enter the trade as soon as the signal is triggered. Place your Stop Loss at the SL line and your Take Profit at the TP line, ensuring you follow the 1:2 risk-to-reward ratio for optimal trade management.
Benefits of Using the Indicator
- Automation: The indicator automates the plotting of Buy and Sell signals, making it easier to spot opportunities without manual analysis.
- Risk Management: With dynamic Stop Loss and Take Profit levels, the indicator offers built-in risk management, crucial for protecting your capital.
- Clear Entry Points: The entry points are visually represented on the chart, ensuring traders don’t miss critical market movements.
- Adaptable to Market Conditions: The Chandelier Stop method adapts to market volatility, making the Stop Loss level dynamic and protective.
Conclusion
This custom indicator on TradingView, powered by Pine Script, offers an excellent way to streamline your trading strategy. By automating the identification of Buy and Sell signals, along with automatic plotting of Entry, Stop Loss, and Take Profit levels, traders can focus on executing trades with precision and confidence. The integration of dynamic risk management further enhances the indicator’s value, ensuring that trades are both profitable and well-managed. Whether you are new to trading or an experienced trader, this indicator can be a valuable tool for improving your trading efficiency and profitability.
By utilizing this indicator in combination with the power of TradingView and Pine Script, you can optimize your trading strategy and take your trading to the next level.
Pinescript of EMA 50 Breakout & Pullback Indicator
To access this indicator, reach out to us at +91 7620658346. We specialize in custom algorithm development for TradingView, MT4/MT5, and trading bots.
Follow @algo_aakash on Instagram, YouTube, and Twitter to stay updated.
Disclaimer
The information in this article and any related indicators is for educational purposes only. Trading financial markets involves substantial risk, and there is no guarantee of profit. EMA 50 Breakout & Pullback Indicator, which may not accurately predict future market behavior. Users should conduct their own research, assess their risk tolerance, and consult with a licensed financial advisor before making any trading decisions. The author and developer of this indicator are not responsible for any losses incurred from its use. Please trade responsibly.

0 Comments