
What is T3MA Ribbon R1 by JustUncleL with RSI Indicator
In the world of trading, indicators are essential tools used to help traders make informed decisions. One such popular indicator used on TradingView is the T3MA Ribbon R1 by JustUncleL. It is a strategy that incorporates two key indicators: T3 Moving Averages (T3MA) and the Relative Strength Index (RSI). Understanding how this indicator works on TradingView, along with its setup, will help you leverage it for better trading decisions.

What is the T3MA Ribbon R1 Indicator?
The T3MA Ribbon R1 by JustUncleL is a trading strategy indicator designed to help traders identify trends, market strength, and reversal points. The T3MA is an advanced type of moving average that applies a weighted calculation to smooth out price data more effectively than traditional moving averages. It is known for being responsive to price changes while reducing the lag that usually comes with moving averages.
The T3MA Ribbon strategy uses a combination of fast and slow T3MA, along with the RSI to create a well-rounded trading signal. The T3MA Ribbon R1 works particularly well for short-term traders, especially those using 5-minute timeframes, as the strategy is designed to give quick buy and sell signals.
How Does T3MA Ribbon R1 by JustUncleL with RSI Work on TradingView?
TradingView is one of the most popular platforms among traders for charting and analysis. It allows you to apply different custom indicators to better understand market trends and signals. The T3MA Ribbon R1 strategy can be applied to TradingView by adding the indicator on your chart and customizing the settings according to your preferences.
Step-by-Step Setup on TradingView:
- Add the T3MA Ribbon R1 Indicator:
- Open your TradingView chart.
- In the top panel, click on the “Indicators” button and search for “T3MA Ribbon R1 by JustUncleL.”
- Add the indicator to your chart.
- Adjust Indicator Settings: The T3MA Ribbon R1 has several customizable settings that allow you to fine-tune the strategy to your needs. Here’s a breakdown of the key settings:
- Fast T3MA Length (3): This setting controls the speed of the faster T3 moving average. A shorter length, such as 3, allows the indicator to react quicker to price changes.
- Fast T3 Volume Factor (1): This parameter affects the volume of the T3 moving average. A value of 1 is typically used for standard calculation.
- Slow T3 Length (9): The slow-moving average reacts slower to price changes and is typically used to identify longer-term trends.
- Slow T3 Volume Factor (0.6): The slow volume factor smoothens out volatility in the market and helps to filter out erratic price movements.
- T3 MA Source (Close): The source is the price point at which the moving average calculation is based. Typically, it’s set to “Close” for standard trading, but it can be adjusted depending on the strategy.
- Incorporate the RSI: To complement the T3MA Ribbon, you also need to set up the RSI indicator. The settings for the RSI are:
- RSI Upper Band (63): This level helps identify overbought conditions in the market. When the RSI crosses above this level, it suggests that the asset may be overbought.
- RSI Middle Band (50): The middle band is the neutral level for RSI. Prices above 50 are considered bullish, while prices below 50 are considered bearish.
- RSI Lower Band (44): This is the level that indicates oversold conditions in the market. A break below 44 could signal that the asset is oversold and may soon reverse.
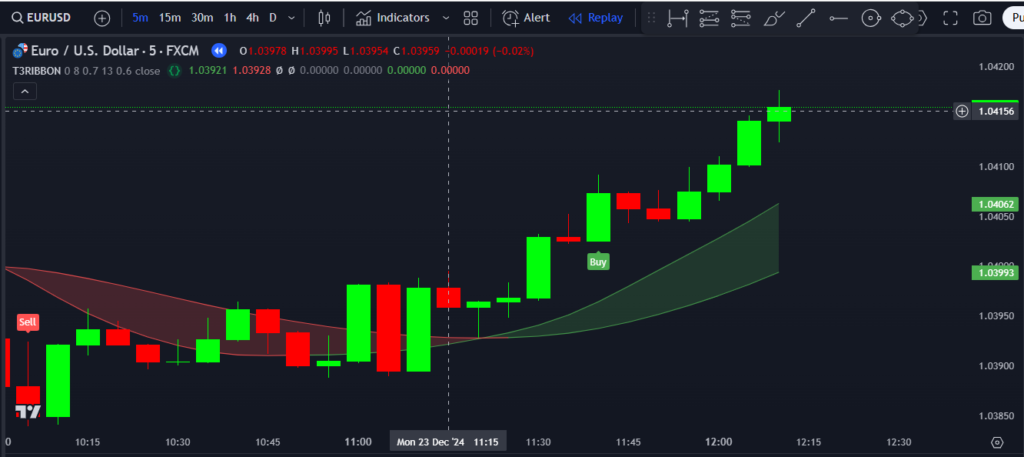
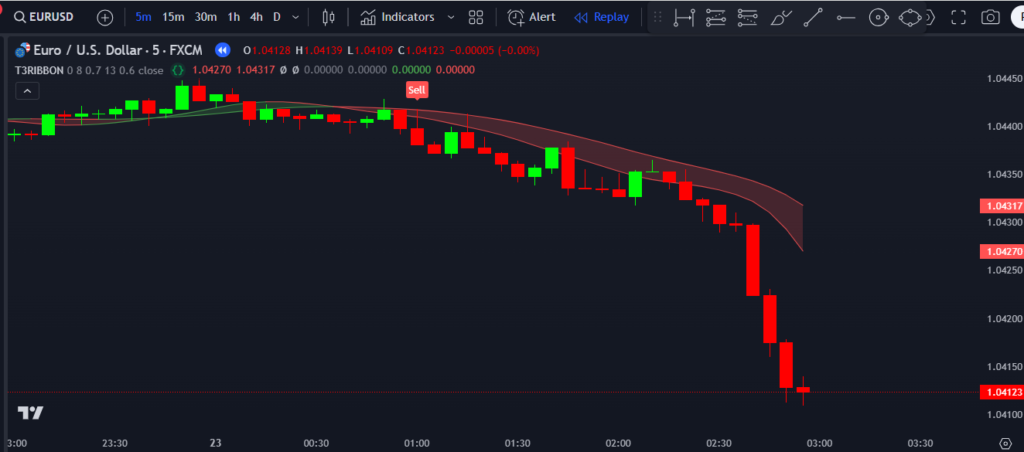
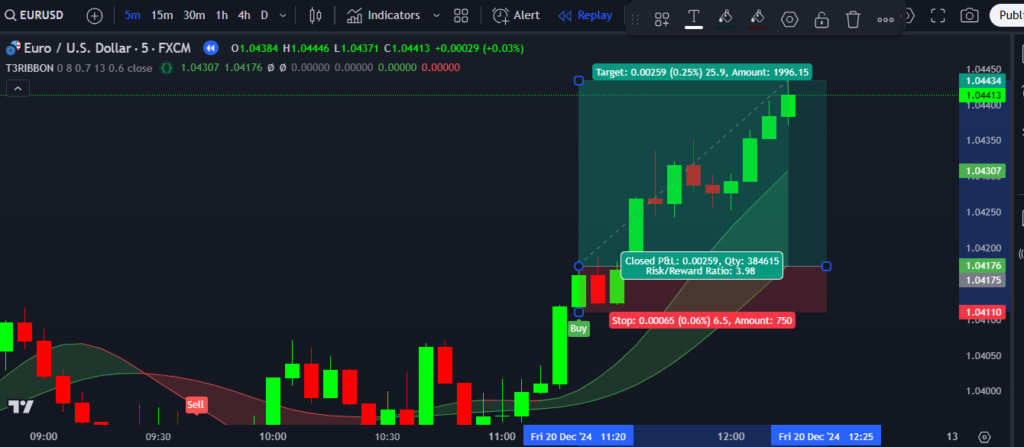
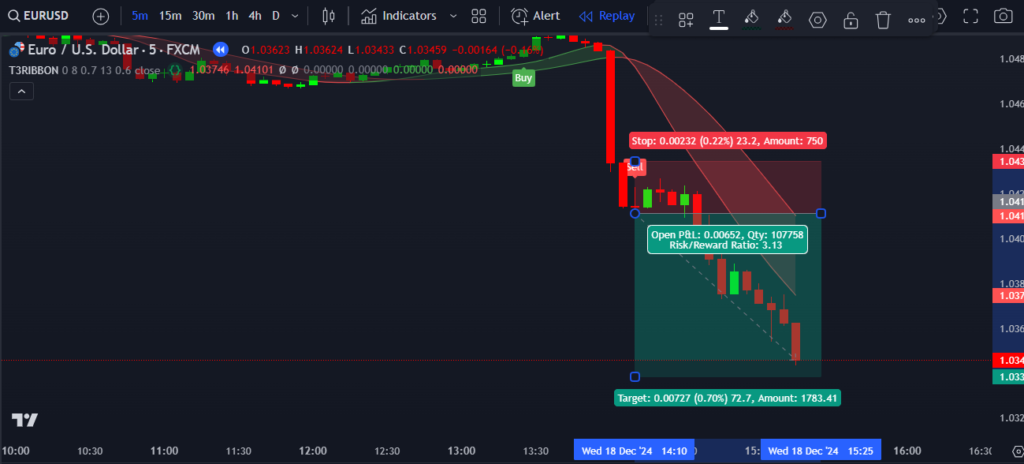
Buy and Sell Conditions Using the T3MA Ribbon R1 Strategy
The T3MA Ribbon R1 strategy combined with the RSI provides precise buy and sell signals, which are critical for traders looking for high-probability trades.
- Buy Condition: A buy signal is triggered when the RSI crosses above the upper band (63). This indicates strong bullish momentum. Simultaneously, the T3MA Ribbon will likely be aligned with the price moving upward, signaling a buying opportunity.
- Conditions: When RSI crosses above 63, and the price is in alignment with the fast T3MA, a trader can enter a long position.
- Sell Condition: A sell signal is generated when the RSI crosses below the lower band (44). This indicates that the market may be oversold and a reversal is imminent. At this point, the T3MA Ribbon will show a downward trend, confirming the signal to sell.
- Conditions: When RSI drops below 44 and the T3MA shows a downward trend, the trader can enter a short position.
Key Benefits of Using T3MA Ribbon R1 with RSI on TradingView
- Increased Accuracy in Signal Generation: The combination of the fast and slow T3MA helps in identifying both short-term trends and long-term market direction. When combined with RSI, this creates a very reliable indicator for spotting entry and exit points.
- Customizable Settings: Traders can fine-tune the indicator’s settings according to their preferred trading style. The ability to adjust both T3MA and RSI parameters offers flexibility, whether you’re trading on a 5-minute chart or a longer timeframe.
- Clear Buy and Sell Signals: The clear buy and sell conditions, based on RSI crossing above 63 for buying and below 44 for selling, reduce ambiguity in decision-making, making it easier for traders to execute trades confidently.
- Works Across Timeframes: While the strategy works best on a 5-minute chart for short-term traders, it can also be used on different timeframes, from minutes to hours, depending on the trader’s objectives.
Final Thoughts on Using T3MA Ribbon R1 on TradingView
The T3MA Ribbon R1 by JustUncleL is a powerful tool for traders looking for a reliable strategy to trade the markets. Its integration with RSI ensures that traders can confirm market trends and conditions before taking action. Whether you’re a beginner or an experienced trader, setting up and using this indicator on TradingView can significantly improve your trading results.
By combining the advanced features of T3MA, RSI, and Pine Script, you can create a highly effective and customized trading system. Whether you’re trading the 5-minute chart or higher timeframes, the T3MA Ribbon R1 strategy helps provide the clear signals you need to succeed in your trading journey.
Pinescript of T3MA Ribbon R1 by JustUncleL with RSI
For access to this indicator, reach out to us at +91 7620658346. We specialize in custom algorithm development for TradingView, MT4/MT5, and trading bots.
Follow @algo_aakash on Instagram, YouTube, and Twitter for the latest updates.
Disclaimer
The information provided in this article and any associated indicators is for educational purposes only. Trading in financial markets carries significant risk, and there is no guarantee of profit. T3MA Ribbon R1 by JustUncleL with RSI, which may not accurately reflect future market movements. Users should perform their own research, evaluate their risk tolerance, and consult a licensed financial advisor before making any trading decisions. The author and developer of this indicator are not responsible for any losses incurred through its use. Please trade responsibly.

0 Comments