🔓 Get All Tools for FREE!
- ✅ Click here to open a trading account using our referral link and start trading.
- 📅 After 7 days of active trading under our referral link, you can get access to all tools in your account.
- ⚠️ Keep trading to keep access free — if you're inactive for 7 days, your access will be removed.
- 👉 Already have an account? You can change the IB (introducing broker) to our referral link ( https://one.exnesstrack.org/a/w7syl3vnjb ) and still qualify!
What 5 RSI + 20 EMA Strategy the Indicator?
The 5 RSI + 20 EMA Strategy Indicator is a simple yet powerful tool designed for traders using TradingView. This indicator combines the sensitivity of the 5-period Relative Strength Index (RSI) with the trend-following capabilities of the 20-period Exponential Moving Average (EMA). Together, they help identify potential buy and sell opportunities in various market conditions. By analyzing price momentum and trend direction, this strategy aims to provide traders with clear entry and exit signals, making it a reliable choice for swing and day trading.
How 5 RSI + 20 EMA Strategy Indicator Works on TradingView
The indicator is built using Pine Script, TradingView’s proprietary scripting language. Here’s how the strategy works step-by-step:
🔓 Get All Tools for FREE!
- ✅ Click here to open a trading account using our referral link and start trading.
- 📅 After 7 days of active trading under our referral link, you can get access to all tools in your account.
- ⚠️ Keep trading to keep access free — if you're inactive for 7 days, your access will be removed.
- 👉 Already have an account? You can change the IB (introducing broker) to our referral link ( https://one.exnesstrack.org/a/w7syl3vnjb ) and still qualify!
- Indicator Setup
- Timeframe: The strategy is most effective on a 1-day timeframe, ensuring traders focus on significant price movements.
- RSI Settings: Set the RSI length to 5, making it highly sensitive to price and momentum changes. This sensitivity is crucial for detecting short-term shifts in the market.
- Moving Average: Use a 20-period EMA (Exponential Moving Average), which smoothens price data and helps identify the trend direction.
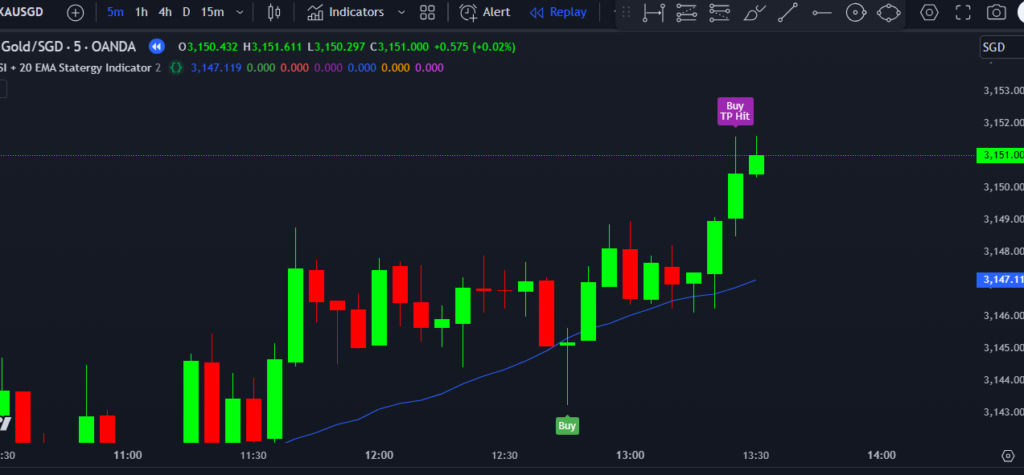
- Buy Signal (Uptrend Confirmation)
- When the price moves above the 20 EMA, it signals an uptrend.
- Check the RSI level: If it is above 50, the market is bullish, and traders can confidently look for buy opportunities.
- The entry point can be fine-tuned to align with price action and candlestick patterns.
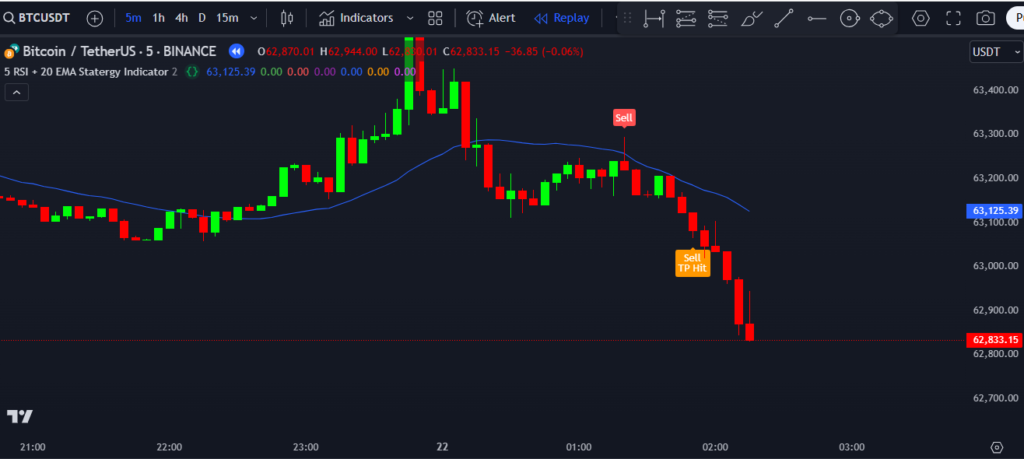
- Sell Signal (Downtrend Confirmation)
- When the price moves below the 20 EMA, it indicates a potential downtrend.
- If the RSI drops below 50, it confirms bearish momentum. This is an ideal condition for placing sell trades.
- Additional confirmation can be obtained when the price touches the 20 EMA and then moves downward, showing resistance at the moving average.
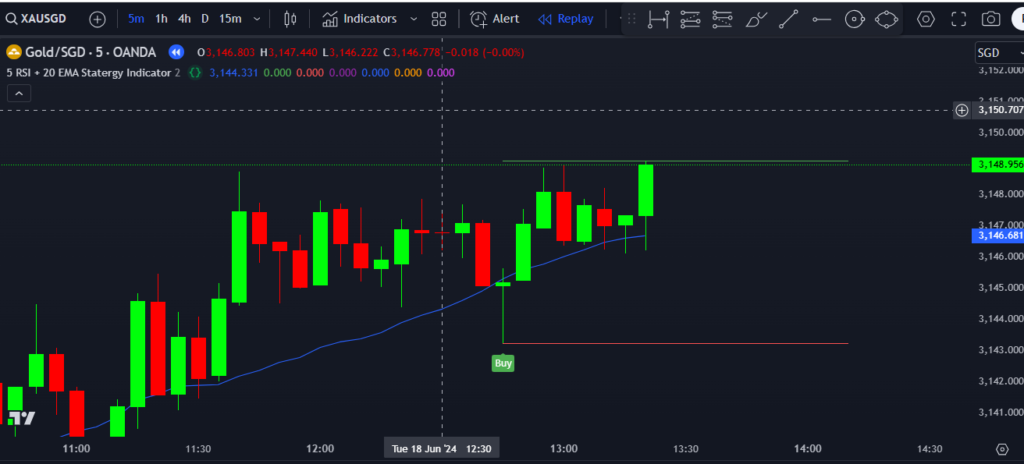
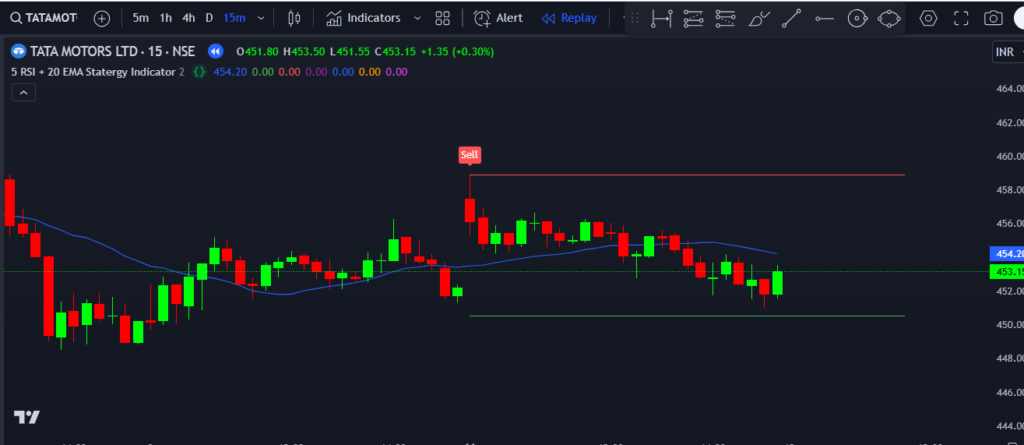
- Stop Loss and Risk Management
- Place the stop-loss above the high of the previous candle for sell trades or below the low of the previous candle for buy trades.
- Aim for a risk-to-reward ratio of 1:2, ensuring that the potential reward is twice the risk taken.
- Market Sensitivity
- The 5 RSI is more sensitive to price and momentum changes, making it particularly effective in volatile markets. This sensitivity allows traders to capture quick reversals and trends in the market.
Explanation of the Indicator
The 5 RSI + 20 EMA Strategy is based on the principle of combining momentum indicators with trend-following tools. The RSI helps gauge market momentum, while the 20 EMA acts as a dynamic support or resistance level. Here’s a detailed breakdown of its key components:
- RSI (Relative Strength Index):
- The RSI is set to 5, making it more responsive to short-term price changes. This setup is particularly useful for identifying early signs of trend reversals.
- When the RSI is above 50, the market is considered bullish, indicating higher chances of upward movement.
- When the RSI is below 50, it reflects bearish conditions, signaling a potential downward trend.
- 20 EMA (Exponential Moving Average):
- The EMA is a trend-following tool that gives more weight to recent price data, making it more reactive to market changes compared to a Simple Moving Average (SMA).
- The price’s position relative to the EMA serves as a clear indicator of the trend. Prices above the EMA suggest an uptrend, while prices below indicate a downtrend.
Indicator Overview
This strategy is versatile and works across various market conditions, whether you’re trading stocks, forex, or cryptocurrencies on TradingView. Here’s a summary of its functionality:
- Trend Identification:
The 20 EMA acts as a boundary to determine whether the market is in an uptrend or a downtrend. - Momentum Sensitivity:
The 5 RSI’s shorter calculation period makes it quick to react to market changes, offering traders an edge in fast-moving markets. - Entry and Exit Signals:
- Buy when the price crosses above the 20 EMA, with RSI confirming bullish momentum (above 50).
- Sell when the price moves below the 20 EMA, with RSI confirming bearish momentum (below 50).
- Risk Management:
By setting stop-loss levels at the previous candle’s high or low and maintaining a 1:2 risk-reward ratio, traders can manage their risks effectively.
Benefits of Using This Indicator on TradingView
- Customization with Pine Script:
TradingView allows users to modify this strategy using Pine Script, enabling traders to adapt the indicator to suit their specific needs or trading style. - Clear Signals:
The combination of price action (20 EMA) and momentum (5 RSI) ensures clear, actionable signals, reducing ambiguity in decision-making. - User-Friendly Interface:
TradingView’s intuitive charting platform makes it easy to apply the indicator, analyze the market, and execute trades. - Cross-Market Applicability:
This strategy works across multiple asset classes, including forex, stocks, and crypto, making it a valuable tool for diverse trading portfolios.
Final Thoughts
The 5 RSI + 20 EMA Strategy Indicator on TradingView is a robust tool for identifying market trends and momentum shifts. By leveraging the power of Pine Script, traders can automate and customize this indicator to optimize their trading strategies. Whether you’re a beginner or an experienced trader, this strategy offers a systematic approach to analyzing the market and executing trades with confidence. With proper risk management and discipline, this indicator can significantly enhance your trading performance.
Pinescript of 5 RSI + 20 EMA Strategy Indicator
Contact us at +91 7620658346 to get access to this indicator. We offer custom algorithm development for TradingView, MT4/MT5, and trading bots.
Follow @algo_aakash on Instagram, YouTube, and Twitter for the latest updates.
Disclaimer
The content provided in this article and any associated indicators is for educational purposes only. Trading in financial markets carries significant risk, and profits are not guaranteed. 5 RSI + 20 EMA Strategy Indicator, which may not accurately predict future market trends. Users should conduct their own research, assess their risk tolerance, and consult a licensed financial advisor before making any trading decisions. The author and developer of this indicator are not responsible for any losses incurred through its use. Please trade responsibly.
https://www.tradingview.com/script/h3JNaKo7-5-RSI-20-EMA-Statergy-Indicator-algo-aakash/Click here to interact with the feature.
🔓 Get This Tool for FREE!
- ✅ Click here to open a trading account using our referral link and start trading.
- 💡 Use coupon code: FREE during checkout.
- 📅 After 7 days of active trading under our referral link, you’ll get access to this tool in your account.
- ⚠️ Keep trading to keep access free — if you're inactive for 7 days, your access will be removed.
- 👉 Already have an account? You can change the IB (introducing broker) to our referral link and still qualify!

0 Comments