🔓 Get All Tools for FREE!
- ✅ Click here to open a trading account using our referral link and start trading.
- 📅 After 7 days of active trading under our referral link, you can get access to all tools in your account.
- ⚠️ Keep trading to keep access free — if you're inactive for 7 days, your access will be removed.
- 👉 Already have an account? You can change the IB (introducing broker) to our referral link ( https://one.exnesstrack.org/a/w7syl3vnjb ) and still qualify!
In the fast-paced world of trading, having a reliable strategy and effective tools can make all the difference between success and failure. One such tool that traders swear by is the 9 EMA ADX Trading Strategy. This strategy combines the Exponential Moving Average (EMA) with the Average Directional Index (ADX) to offer precise buy and sell signals on your TradingView charts. In this article, we will delve into what the 9 EMA ADX Trading Strategy is, how it works on TradingView, and how you can use it to enhance your trading performance.
What is the 9 EMA ADX Trading Strategy?
The 9 EMA ADX Trading Strategy is a trading strategy that utilizes two key indicators: the 9 Exponential Moving Average (EMA) and the Average Directional Index (ADX). These indicators work together to identify trends, determine trend strength, and generate buy or sell signals.
🔓 Get All Tools for FREE!
- ✅ Click here to open a trading account using our referral link and start trading.
- 📅 After 7 days of active trading under our referral link, you can get access to all tools in your account.
- ⚠️ Keep trading to keep access free — if you're inactive for 7 days, your access will be removed.
- 👉 Already have an account? You can change the IB (introducing broker) to our referral link ( https://one.exnesstrack.org/a/w7syl3vnjb ) and still qualify!
- The 9 EMA helps traders understand the market’s short-term momentum by smoothing out price data and highlighting potential entry and exit points.
- The ADX is used to assess the strength of a trend, which is crucial for confirming the signals generated by the 9 EMA.
The strategy is popular for its simplicity and effectiveness, making it a favorite for both beginner and experienced traders. It is primarily used for trend-following strategies, where traders look to enter the market in the direction of the prevailing trend and exit when the trend shows signs of weakening.
How Does the 9 EMA ADX Trading Strategy Work on TradingView?
TradingView is one of the most popular platforms for traders worldwide, providing a wide array of tools and custom indicators, including Pine Script for creating custom strategies. To implement the 9 EMA ADX Trading Strategy on TradingView, you can use a custom Pine Script that combines the two indicators.
Step 1: Setting Up the 9 EMA
The 9 EMA is calculated by taking the weighted average of price data, giving more importance to recent prices. This makes it more sensitive to price movements, which can help identify short-term trend reversals or continuations.
On TradingView, you can easily add the 9 EMA to your chart by following these steps:
- Open your TradingView chart.
- Click on the Indicators tab.
- Search for Exponential Moving Average (EMA) and select it.
- Change the period to 9 for the 9 EMA.
The 9 EMA will appear as a line on your chart, which you will use to track the short-term price movement.
Step 2: Adding the ADX Indicator
The Average Directional Index (ADX) is a trend-following indicator that measures the strength of a trend without indicating its direction. It ranges from 0 to 100, where a higher value indicates a stronger trend.
To add the ADX on TradingView:
- Click on the Indicators tab.
- Search for Average Directional Index (ADX) and select it.
- The ADX will appear as a separate panel below your main chart.
The ADX line will be displayed, along with two additional lines, the +DI (Positive Directional Indicator) and -DI (Negative Directional Indicator). When the ADX line is above 25, it indicates a strong trend, and when it’s below 20, it suggests weak or no trend.
Step 3: Combining the 9 EMA with the ADX
Now that you have both the 9 EMA and the ADX on your chart, it’s time to combine them for the 9 EMA ADX Trading Strategy. The primary signals come from the interaction between these two indicators:
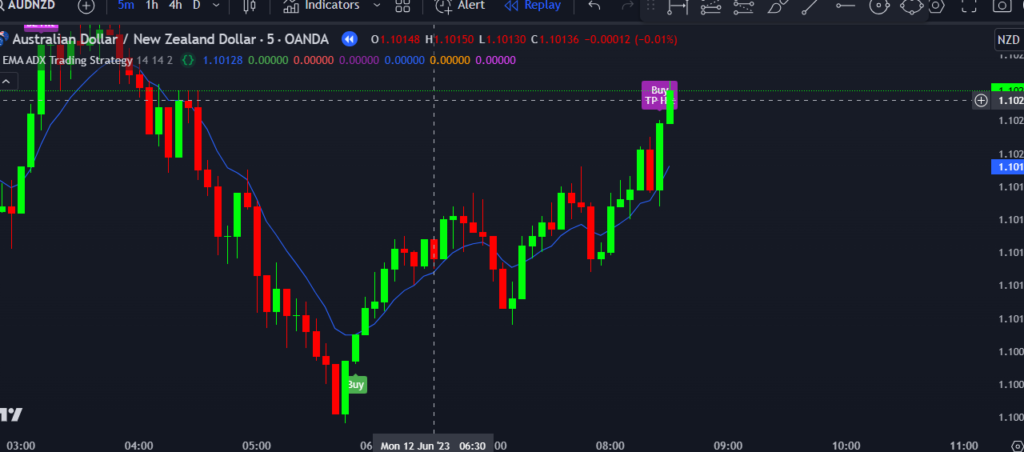
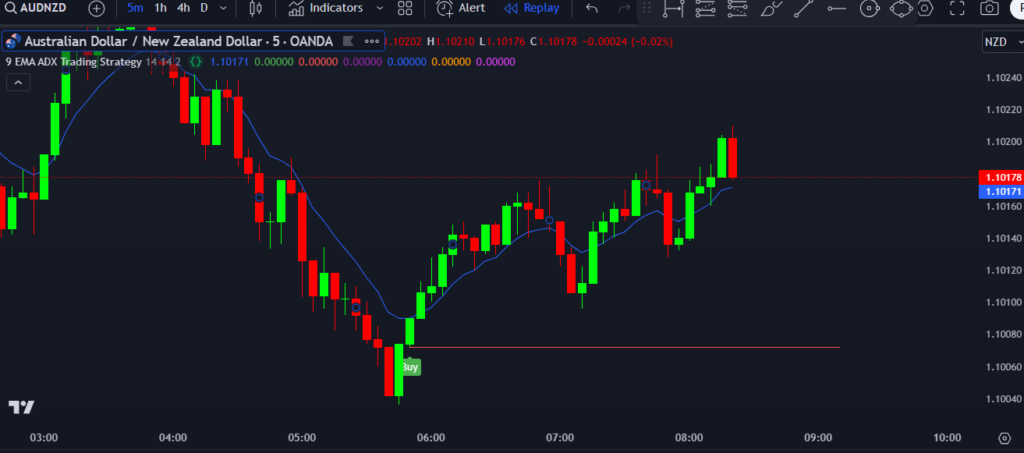
- Buy Signal: A buy signal occurs when the price is above the 9 EMA, and the ADX line is above 25, indicating a strong uptrend. Additionally, the +DI should be above the -DI, confirming the bullish trend.
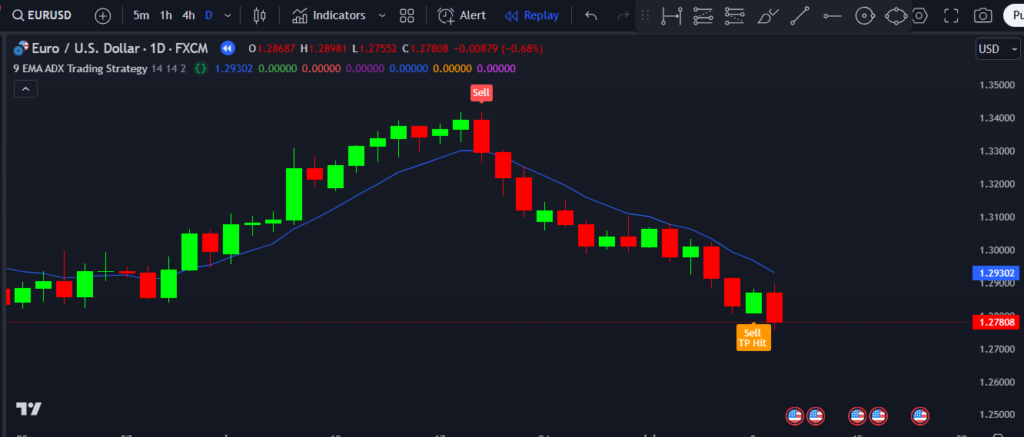
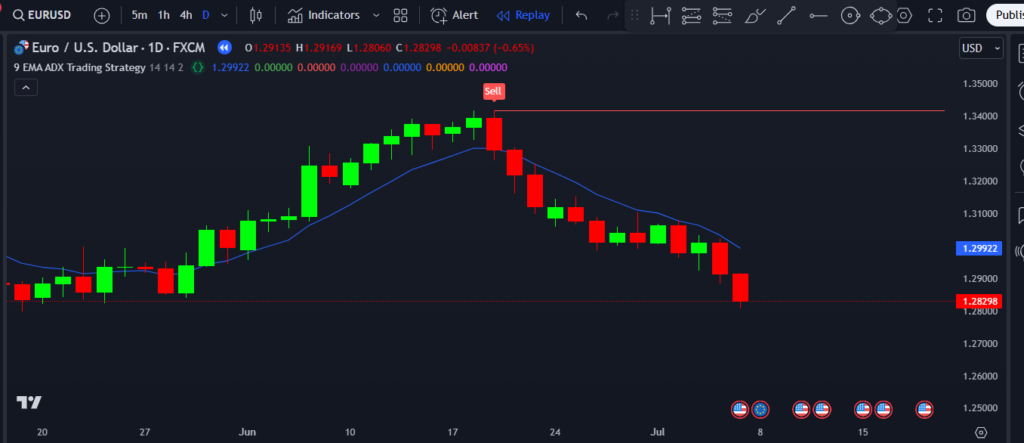
- Sell Signal: A sell signal occurs when the price is below the 9 EMA, and the ADX line is above 25, signaling a strong downtrend. The -DI should be above the +DI to confirm the bearish trend.
When the ADX is below 20, it indicates a weak or no trend, and it’s best to avoid entering the market as price movements are likely to be unpredictable.
Benefits of Using the 9 EMA ADX Trading Strategy on TradingView
- Trend Confirmation: By combining the 9 EMA with the ADX, this strategy ensures that trades are made in the direction of the prevailing trend, improving the likelihood of profitable trades.
- Simplicity: The strategy is easy to implement and follow. By focusing on the 9 EMA for short-term momentum and ADX for trend strength, it avoids the complexity of more advanced strategies.
- Clear Entry and Exit Signals: The Pine Script customization provides clear buy and sell signals, which eliminates confusion and helps traders make quicker decisions.
- Adaptability: This strategy works across various timeframes and markets, including forex, stocks, and crypto. Whether you are trading short-term or long-term, the 9 EMA ADX strategy can be customized to suit your needs.
Conclusion
The 9 EMA ADX Trading Strategy is an excellent tool for traders looking to capitalize on trend movements with clear, actionable signals. By using the 9 EMA to track short-term momentum and the ADX to measure trend strength, traders can identify high-probability entry and exit points.
When applied on TradingView, this strategy becomes even more powerful, especially with the ability to customize indicators using Pine Script. With its simple yet effective approach, the 9 EMA ADX Trading Strategy is an indispensable tool for any trader looking to enhance their trading performance.
By integrating this strategy into your trading plan and utilizing TradingView’s advanced charting tools, you can take your trading to the next level and achieve better, more consistent results.
Pinescript of 9 EMA ADX Trading Strategy TradingView Indicator
Contact us at +91 7620658346 to access this indicator. We specialize in algorithm development for TradingView, MT4/MT5, and trading bots.
Follow @algo_aakash on Instagram, YouTube, and Twitter for the latest updates.
Disclaimer
The information in this article and any related indicators is for educational purposes only. Trading financial markets involves significant risk, and there is no guarantee of profit.9 EMA ADX Trading Strategy TradingView Indicator, which may not predict future market outcomes. Users should conduct their own research, assess their risk tolerance, and consult a licensed financial advisor before making any trading decisions. The author and developer of this indicator are not liable for any losses incurred through its use. Please trade responsibly.
Click here to interact with the feature
🔓 Get This Tool for FREE!
- ✅ Click here to open a trading account using our referral link and start trading.
- 💡 Use coupon code: FREE during checkout.
- 📅 After 7 days of active trading under our referral link, you’ll get access to this tool in your account.
- ⚠️ Keep trading to keep access free — if you're inactive for 7 days, your access will be removed.
- 👉 Already have an account? You can change the IB (introducing broker) to our referral link and still qualify!

0 Comments