🔓 Get All Tools for FREE!
- ✅ Click here to open a trading account using our referral link and start trading.
- 📅 After 7 days of active trading under our referral link, you can get access to all tools in your account.
- ⚠️ Keep trading to keep access free — if you're inactive for 7 days, your access will be removed.
- 👉 Already have an account? You can change the IB (introducing broker) to our referral link ( https://one.exnesstrack.org/a/w7syl3vnjb ) and still qualify!
The Enhanced Trailing Stop Loss (TSL+) indicator is an innovative trading tool that helps traders efficiently manage their stop-loss levels. This indicator integrates key technical concepts, such as highs and lows from a higher timeframe, and adjusts them according to market volatility using the Average True Range (ATR). It allows traders to protect their profits in volatile markets by dynamically adjusting stop-loss levels to match broader market conditions.
What is Enhanced Trailing Stop Loss (TSL+) Indicator
The TSL+ indicator is designed to improve the traditional stop-loss mechanism by using a dynamic, data-driven approach. Unlike static stop-loss levels that are fixed based on entry points, the TSL+ dynamically updates in response to changing market conditions. This ensures that stop-losses remain relevant and responsive, minimizing the risk of being stopped out too early in volatile markets.
🔓 Get All Tools for FREE!
- ✅ Click here to open a trading account using our referral link and start trading.
- 📅 After 7 days of active trading under our referral link, you can get access to all tools in your account.
- ⚠️ Keep trading to keep access free — if you're inactive for 7 days, your access will be removed.
- 👉 Already have an account? You can change the IB (introducing broker) to our referral link ( https://one.exnesstrack.org/a/w7syl3vnjb ) and still qualify!
How Enhanced Trailing Stop Loss (TSL+) Indicator Works:
- Higher Timeframe Highs and Lows:
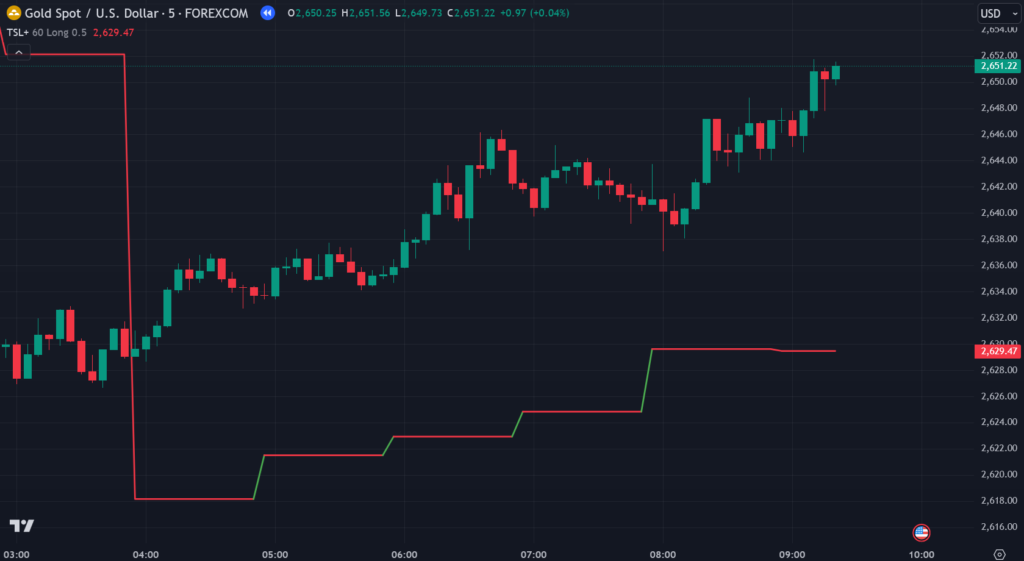
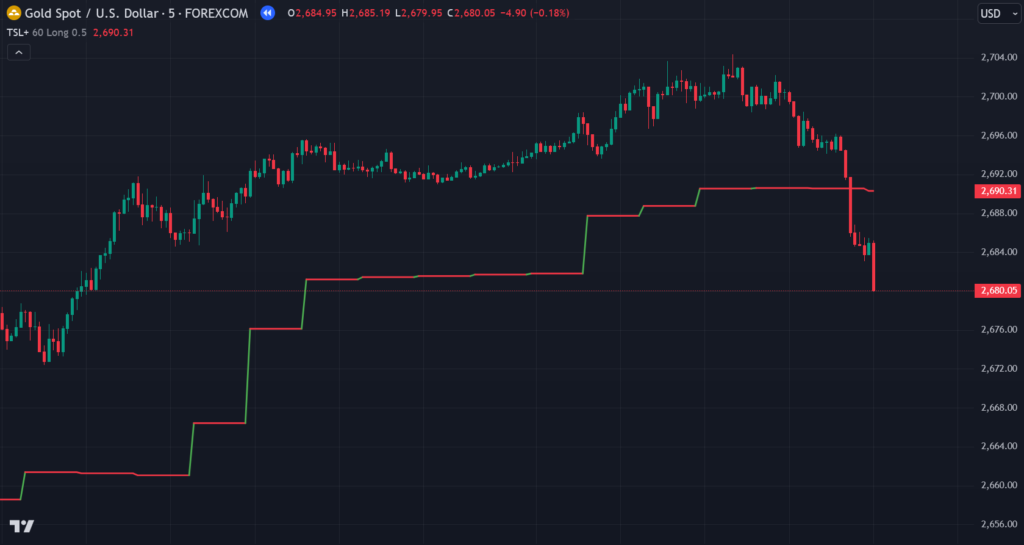
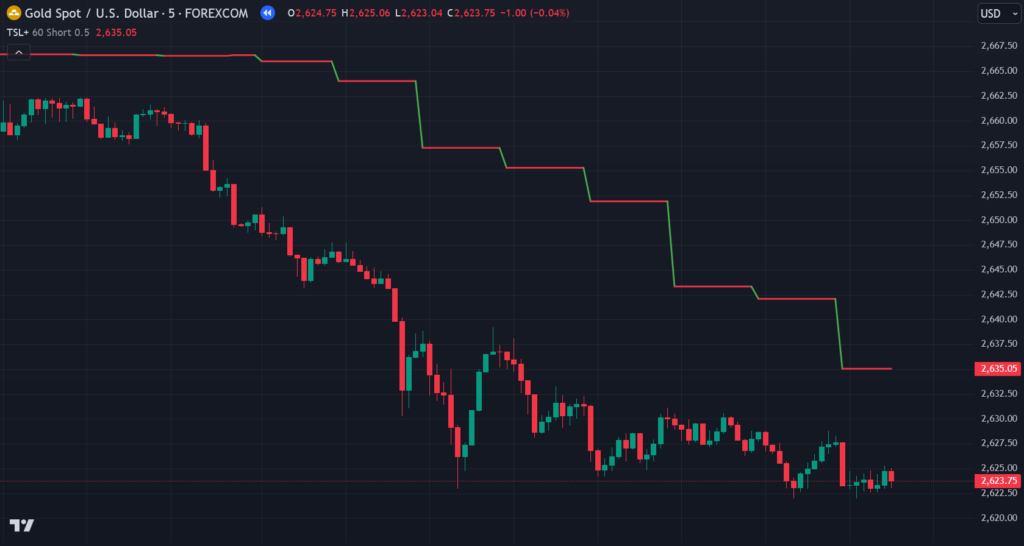
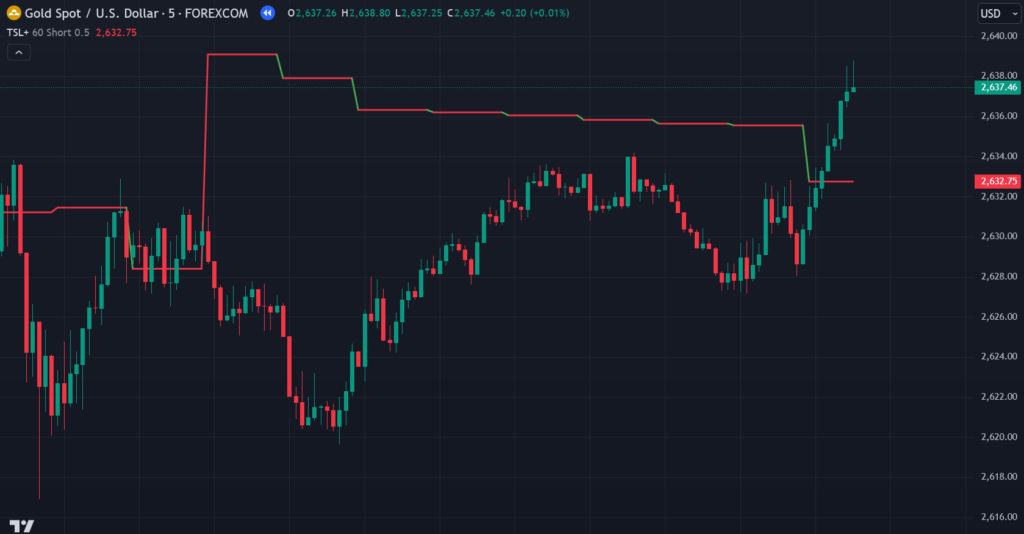
- The TSL+ indicator calculates stop-loss levels using the highs and lows from a higher timeframe, such as the daily or weekly chart. This approach is beneficial for long and short trades by considering the broader market trend, providing a more stable stop-loss level.
- For Long positions, the indicator calculates a buffered low based on significant lows from the selected higher timeframe. This buffered low acts as the stop-loss level, trailing below the price as the trade progresses.
- For Short positions, the indicator calculates a buffered high based on significant highs from the selected timeframe. This buffered high acts as the stop-loss level, trailing above the price in a similar manner.
- ATR Adjustment:
- The ATR (Average True Range) multiplier is used to adjust the stop-loss levels based on market volatility. The ATR is a well-known technical indicator that measures market volatility by calculating the average range between the high and low prices over a specific period.
- By applying the ATR multiplier, the TSL+ indicator adds a volatility buffer around the calculated highs and lows, ensuring that the stop-loss level accounts for market fluctuations. This prevents the stop-loss from being triggered prematurely due to short-term price movements.
- Dynamic Updates:
- One of the key features of the TSL+ indicator is its ability to dynamically adjust as new highs or lows are formed on the higher timeframe. This means that as the market trends, the stop-loss level is automatically recalculated and updated in real-time, providing traders with an up-to-date protection mechanism for their positions.
Input Features:
The TSL+ indicator offers several customizable input features to align with individual trading strategies:
- Time Frame (tf):
- This option allows traders to select the timeframe from which the indicator will pull highs and lows. Common choices include daily or weekly timeframes, but traders can customize it based on their trading style. By using higher timeframes, traders can better align their stop-loss levels with broader market trends, avoiding unnecessary adjustments due to short-term price movements.
- Type (type_):
- Traders can choose between “Long” or “Short” positions depending on their trade direction. For long trades, the TSL+ will calculate stop-loss levels based on lower prices, while for short trades, it will calculate levels based on higher prices.
- ATR Multiplier (atr_multiplier):
- This input allows traders to adjust the size of the volatility buffer added to the stop-loss levels. By increasing the multiplier, traders can widen their stop-loss to accommodate more market volatility, while decreasing it tightens the stop-loss, making it more sensitive to price movements.
How to Use:
The TSL+ indicator can be used in both long and short trades, providing a clear, visual representation of where stop-loss levels should be placed. Here’s how to use it:
- For Long Trades:
- The TSL+ indicator will plot a green (or red) line below the price action. This line represents the trailing stop-loss level, which adjusts as new lows from the higher timeframe are formed. Traders should use the plotted TSL line to manage their stop-loss for long trades, trailing it below the price as the market moves in their favor.
- For Short Trades:
- The TSL+ indicator will plot a green (or red) line above the price action for short trades. This line represents the trailing stop-loss level, which trails above the price as new highs from the higher timeframe are formed. Traders should use the plotted TSL line to manage their stop-loss for short trades, trailing it above the price.
- Green TSL Line:
- The green TSL line indicates favorable market conditions, suggesting that the price is trending in the direction of the trade. A green line means that the market is likely to continue moving in the trader’s favor, and the stop-loss can be trailed accordingly.
- Red TSL Line:
- The red TSL line signals a potential reversal or unfavorable market conditions. When the line turns red, it’s an indication that the price is moving against the trader’s position, and the stop-loss should be adjusted accordingly to protect the trade.
Trading Benefits:
The Enhanced Trailing Stop Loss (TSL+) indicator offers several advantages to traders, especially those focusing on swing and position trading strategies. Some of the key benefits include:
- Broad Market Perspective:
- By pulling highs and lows from a higher timeframe, the TSL+ indicator aligns stop-loss levels with broader market trends, making them less sensitive to intraday noise. This provides traders with a clearer view of the market, reducing the risk of being stopped out by short-term fluctuations.
- Volatility-Responsive:
- The ATR-based buffer ensures that stop-loss levels are adjusted to reflect market volatility. This means that during periods of high volatility, the stop-loss will automatically widen to accommodate larger price swings, while during periods of low volatility, it will tighten, offering more protection against small price movements.
- Simplified Execution:
- The TSL+ indicator makes it easier for traders to manage their stop-loss levels. By plotting them directly on the chart, it provides a visual representation of where the stop-loss should be placed, streamlining the decision-making process in fast-moving markets.
- Better Risk Management:
- With dynamic stop-loss levels that adjust according to market conditions, traders can better protect their positions and manage risk. The ATR-based adjustment ensures that stop-losses are placed strategically, reducing the chances of premature exits and allowing traders to ride the trends for longer.
Conclusion:
The Enhanced Trailing Stop Loss (TSL+) indicator is an essential tool for traders who want to enhance their risk management strategies on TradingView. By dynamically adjusting stop-loss levels based on higher timeframe highs/lows and market volatility (ATR), the TSL+ indicator helps traders stay in profitable trades for longer and avoid being prematurely stopped out. Whether you are a swing trader, position trader, or just someone looking for a more reliable stop-loss mechanism, this indicator offers a powerful solution for managing your trades in a volatile market.
By using the TSL+ indicator, traders can ensure that their stop-loss strategy is aligned with broader market trends, offering them more flexibility and precision in managing risk. This indicator is a must-have for any serious trader who uses TradingView and Pine Script to build and execute their trading strategies.
Pinescript of Enhanced Trailing Stop Loss (TSL+) Indicator
For access to this indicator, contact us at +91 7620658346. We offer algorithm development services for TradingView, MT4/MT5, and trading bots.
Follow @algo_aakash on Instagram, YouTube, and Twitter for updates.
Disclaimer
The information in this article and any related indicators is provided for educational purposes only. Trading in financial markets involves significant risk, and profits are not guaranteed. The custom Bollinger Band strategy is based on historical data and technical analysis, which may not accurately predict future market conditions. Users should conduct their own research, assess their individual risk tolerance, and consult with a licensed financial advisor before making any trading decisions. The author and the developer of this indicator are not responsible for any losses that may result from the use of this strategy. Always trade responsibly.
Click here to interact with the feature.
🔓 Get This Tool for FREE!
- ✅ Click here to open a trading account using our referral link and start trading.
- 💡 Use coupon code: FREE during checkout.
- 📅 After 7 days of active trading under our referral link, you’ll get access to this tool in your account.
- ⚠️ Keep trading to keep access free — if you're inactive for 7 days, your access will be removed.
- 👉 Already have an account? You can change the IB (introducing broker) to our referral link and still qualify!

0 Comments