🔓 Get All Tools for FREE!
- ✅ Click here to open a trading account using our referral link and start trading.
- 📅 After 7 days of active trading under our referral link, you can get access to all tools in your account.
- ⚠️ Keep trading to keep access free — if you're inactive for 7 days, your access will be removed.
- 👉 Already have an account? You can change the IB (introducing broker) to our referral link ( https://one.exnesstrack.org/a/w7syl3vnjb ) and still qualify!
In today’s fast-paced trading environment, identifying the right moments to enter or exit trades is critical for success. Traders often rely on technical indicators to assist in decision-making, and one of the most effective tools for this is the combination of the MACD (Moving Average Convergence Divergence) with the 200 EMA (Exponential Moving Average). These indicators help traders navigate the complexities of market trends and momentum, making their trading strategies more robust.
This article explores a custom-built MACD Cross with 200 EMA Indicator for TradingView, which is designed not only to signal potential buy and sell opportunities but also to incorporate dynamic stop-loss (SL) and take-profit (TP) levels. This tool is essential for trend identification, momentum analysis, and trade management.
What is the MACD Cross with 200 EMA Indicator?
🔓 Get All Tools for FREE!
- ✅ Click here to open a trading account using our referral link and start trading.
- 📅 After 7 days of active trading under our referral link, you can get access to all tools in your account.
- ⚠️ Keep trading to keep access free — if you're inactive for 7 days, your access will be removed.
- 👉 Already have an account? You can change the IB (introducing broker) to our referral link ( https://one.exnesstrack.org/a/w7syl3vnjb ) and still qualify!
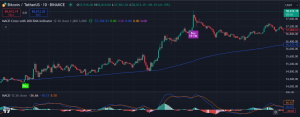
The MACD Cross with 200 EMA Indicator is a powerful trading tool that integrates two widely used technical analysis concepts: the MACD and the 200 EMA. It helps traders by plotting clear buy and sell signals based on the crossovers of the MACD signal line and filtering these signals with the 200 EMA to ensure that trades align with the broader market trend.
In addition to generating buy and sell signals, this indicator sets custom stop-loss and take-profit levels automatically. These risk management tools allow traders to manage their trades more effectively, ensuring that they can protect their capital and optimize their profits.

Mastering Trade Management with the Custom MACD Cross and 200 EMA Indicator for TradingView
How Does the MACD Cross with 200 EMA Indicator Work?
This custom indicator works by combining the momentum-based MACD with the trend-following 200 EMA, ensuring that trades are filtered to align with the overall market direction. Let’s break down the process of how this indicator operates:
1. MACD Calculation:
– The MACD is calculated by subtracting the 26-period Exponential Moving Average (EMA) from the 12-period EMA, creating the MACD line. A 9-period EMA of the MACD line, known as the signal line, is plotted alongside the MACD.
– Buy signals are generated when the MACD line crosses above the signal line, indicating that bullish momentum is increasing. Sell signals occur when the MACD line crosses below the signal line, signaling that bearish momentum is gaining strength.
– This momentum-based approach is especially useful for identifying potential trend reversals or continuations.
2. 200 EMA Trend Filter:
– While the MACD crossovers provide valuable insights into momentum shifts, adding a 200 EMA filter refines the signals, ensuring that trades are aligned with the dominant trend.
– A buy signal is considered valid only if the price is above the 200 EMA, indicating that the asset is in an uptrend. Conversely, a sell signal is valid if the price is below the 200 EMA, which signifies a downtrend.
– This filter helps traders avoid entering trades against the prevailing trend, reducing the risk of false signals during market pullbacks or corrections.
3. Stop-Loss (SL) and Take-Profit (TP) Levels:
– One of the standout features of this custom indicator is its ability to automatically plot stop-loss (SL) and take-profit (TP) levels when a buy or sell signal is triggered.
– Traders can customize these levels based on their desired risk-to-reward ratio or strategy preferences. For example, if a buy signal is generated, the SL can be placed just below a recent swing low, while the TP can be set at a predefined level, such as 1.5x or 2x the risk.
– This ensures that each trade is managed with clear exit points, helping traders lock in profits and limit losses.
4. Dynamic Trade Reset :
– Once the price hits either the stop-loss or take-profit level, the indicator automatically removes the lines and resets, preparing for the next trade signal. This allows traders to focus on monitoring the market without manually adjusting the indicator after each trade.
– The dynamic reset function streamlines the trading process, ensuring that no opportunities are missed while managing active trades.
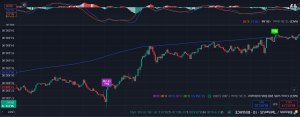
5. Visual Representation for Clear Trade Management:
– To make trade management more intuitive, the indicator uses visual labels and lines to mark entry points, stop-loss, and take-profit levels on the chart. These visual aids make it easy for traders to monitor their open positions and understand their potential risks and rewards at a glance.
– The clarity provided by the visual representation enhances the decision-making process, reducing the emotional stress often associated with manual trade management.
Benefits of Using the MACD Cross with 200 EMA Indicator
This custom MACD Cross with 200 EMA Indicator offers several key advantages for traders looking to improve their strategy and trade management:
1. Improved Trade Filtering: The combination of the MACD and the 200 EMA ensures that traders only take positions aligned with the broader trend, reducing the likelihood of entering trades during market consolidations or false breakouts.
2. Enhanced Momentum Detection: The MACD is a reliable momentum indicator that helps traders identify when a trend is gaining or losing strength. By incorporating the MACD into this custom indicator, traders can better time their entries and exits.
3. Built-in Risk Management: The automatic plotting of stop-loss and take-profit levels simplifies trade management, helping traders protect their capital and optimize their profits without constantly monitoring the markets.
4. Dynamic Reset for Efficiency: The dynamic reset feature ensures that traders are always ready for the next opportunity, allowing them to focus on other aspects of their trading strategy without the need for constant manual adjustments.
5. Visual Trade Management: The use of labels and lines on the chart makes it easier for traders to track their positions and stay aware of their risk-to-reward ratios, reducing emotional decision-making.
Mastering Trade Management with the Custom MACD Cross and 200 EMA Indicator for TradingView
//@version=5
// insta id @algo_aakash
indicator(title=”MACD Cross with 200 EMA Indicator”,overlay = true)
// Getting inputs
fast_length = input(title = “Fast Length”, defval = 12)
slow_length = input(title = “Slow Length”, defval = 26)
src = input(title = “Source”, defval = close)
signal_length = input.int(title = “Signal Smoothing”, minval = 1, maxval = 50, defval = 9, display = display.data_window)
sma_source = input.string(title = “Oscillator MA Type”, defval = “EMA”, options = [“SMA”, “EMA”], display = display.data_window)
sma_signal = input.string(title = “Signal Line MA Type”, defval = “EMA”, options = [“SMA”, “EMA”], display = display.data_window)
// Calculating
fast_ma = sma_source == “SMA” ? ta.sma(src, fast_length) : ta.ema(src, fast_length)
slow_ma = sma_source == “SMA” ? ta.sma(src, slow_length) : ta.ema(src, slow_length)
macd = fast_ma – slow_ma
signal = sma_signal == “SMA” ? ta.sma(macd, signal_length) : ta.ema(macd, signal_length)
hist = macd – signal
ema200 = ta.ema(close,200)
plot(ema200)
inputSL = input.float(50,”SL”)
inputTP = input.float(50,”TP”)
var buyTrigger = true
var sellTrigger = true
var buy_sl = 0.0
var buy_tp = 0.0
var sell_sl = 0.0
var sell_tp = 0.0
var line lineSL = na
var line lineTP = na
buy_sl_hit = (ta.crossunder(low ,buy_sl) or low <= buy_sl ) and buy_sl > 0
buy_tp_hit = (ta.crossover(high , buy_tp) or high >= buy_tp ) and buy_tp > 0
if buy_sl_hit or buy_tp_hit
buy_sl := 0
buy_tp := 0
line.delete(lineSL)
line.delete(lineTP)
sell_sl_hit = (ta.crossover(high , sell_sl) or high >= sell_sl ) and sell_sl > 0
sell_tp_hit = (ta.crossunder(low ,sell_tp) or low <= sell_tp ) and sell_tp > 0
if sell_sl_hit or sell_tp_hit
sell_sl := 0
sell_tp := 0
line.delete(lineSL)
line.delete(lineTP)
var line ln_sl_buy = na
var line ln_tp_buy = na
var label lb1 =na
var label lb2 =na
buy = ta.crossover(macd,signal) and close > ema200 and buyTrigger
sell = ta.crossunder(macd,signal) and close < ema200 and sellTrigger
plotshape(buy, style=shape.labelup, location=location.belowbar, color=#1be100, size=size.tiny, title=’Buy’, text=’Buy’, textcolor=color.white)
plotshape(sell, style=shape.labeldown, location=location.abovebar, color=#fc0000, size=size.tiny, title=’Sell’, text=’Sell’, textcolor=color.white)
if buy
buyTrigger := false
sellTrigger := true
buy_sl := close – inputSL
buy_tp := close + inputTP
sell_sl := 0
sell_tp := 0
line.delete(lineSL)
line.delete(lineTP)
lineSL := line.new(bar_index,buy_sl,bar_index+10,buy_sl,color =color.red)
lineTP := line.new(bar_index,buy_tp,bar_index+10,buy_tp,color =color.green)
if sell
sellTrigger := false
buyTrigger := true
buy_sl := 0
buy_tp := 0
sell_sl := close + inputSL
sell_tp := close – inputTP
line.delete(lineSL)
line.delete(lineTP)
lineSL := line.new(bar_index,sell_sl,bar_index+10,sell_sl,color =color.red)
lineTP := line.new(bar_index,sell_tp,bar_index+10,sell_tp,color =color.green)
if barstate.islast
line.set_x2(lineSL,bar_index + 10)
line.set_x2(lineTP,bar_index + 10)
plotshape(buy_tp_hit, style=shape.labelup, location=location.belowbar, color=color.purple, size=size.tiny, title=’Buy TP Hit’, text=’Buy’+’\n’+’TP Hit’, textcolor=color.white)
plotshape(buy_sl_hit, style=shape.labeldown, location=location.abovebar, color=color.blue, size=size.tiny, title=’Buy SL Hit’, text=’Buy’+’\n’+’SL Hit’, textcolor=color.white)
plotshape(sell_tp_hit, style=shape.labelup, location=location.belowbar, color=color.orange, size=size.tiny, title=’Sell TP Hit’, text=’Sell’+’\n’+’TP Hit’, textcolor=color.white)
plotshape(sell_sl_hit, style=shape.labeldown, location=location.abovebar, color=color.fuchsia, size=size.tiny, title=’Sell SL Hit’, text=’Sell’+’\n’+’SL Hit’, textcolor=color.white)
Mastering Trade Management with the Custom MACD Cross and 200 EMA Indicator for TradingView
Conclusion
The MACD Cross with 200 EMA Indicator for TradingView is a versatile and powerful tool for traders seeking to improve their strategy by combining momentum and trend-following techniques. With built-in stop-loss and take-profit management, this custom indicator allows traders to focus on the most critical aspects of their trades, all while minimizing risk and maximizing profit potential. By using this indicator, traders can gain more confidence in their entries and exits, enhancing their overall trading performance.
Whether you are a novice or an experienced trader, this custom MACD Cross with 200 EMA Indicator can provide a significant edge in the markets, helping you stay ahead of the competition and make informed trading decisions.
Disclaimer
This MACD Cross with 200 EMA Indicator is a custom tool created and shared for educational purposes and to assist you in trading. It is provided as a resource to help with your trading strategy, but it is important to conduct your own research and analysis before making any trading decisions. This indicator is not a guarantee of trading success or profit.
Always exercise caution and consider your own financial situation and risk tolerance. The creators of this indicator are not responsible for any financial losses or damages resulting from its use. Please use this tool responsibly and in conjunction with other research and advice.
🔓 Get This Tool for FREE!
- ✅ Click here to open a trading account using our referral link and start trading.
- 💡 Use coupon code: FREE during checkout.
- 📅 After 7 days of active trading under our referral link, you’ll get access to this tool in your account.
- ⚠️ Keep trading to keep access free — if you're inactive for 7 days, your access will be removed.
- 👉 Already have an account? You can change the IB (introducing broker) to our referral link and still qualify!

0 Comments