🔓 Get All Tools for FREE!
- ✅ Click here to open a trading account using our referral link and start trading.
- 📅 After 7 days of active trading under our referral link, you can get access to all tools in your account.
- ⚠️ Keep trading to keep access free — if you're inactive for 7 days, your access will be removed.
- 👉 Already have an account? You can change the IB (introducing broker) to our referral link ( https://one.exnesstrack.org/a/w7syl3vnjb ) and still qualify!
What Is 5 RSI + 20 EMA Statergy Indicator
Indicators are essential tools in trading, providing traders with insights into market trends, momentum, and potential entry and exit points. They help simplify complex market data, enabling more informed decision-making. This guide explores a unique trading strategy combining a 5 RSI + 20 EMA setup on TradingView, leveraging its simplicity and effectiveness in daily trading.
Explanation of the Indicator:
The 5 RSI + 20 EMA Strategy is designed for use on a daily time frame and is ideal for traders looking for a simple yet effective approach to understanding price momentum and trend direction. Here’s how it works:
🔓 Get All Tools for FREE!
- ✅ Click here to open a trading account using our referral link and start trading.
- 📅 After 7 days of active trading under our referral link, you can get access to all tools in your account.
- ⚠️ Keep trading to keep access free — if you're inactive for 7 days, your access will be removed.
- 👉 Already have an account? You can change the IB (introducing broker) to our referral link ( https://one.exnesstrack.org/a/w7syl3vnjb ) and still qualify!
RSI (Relative Strength Index):
- RSI Length: 5
The shorter RSI length of 5 makes it more sensitive to price and momentum changes, ideal for dynamic trading environments. - Key Observations:
- RSI above 50 indicates a bullish market.
- RSI below 50 signals a bearish market.
EMA (Exponential Moving Average):
- EMA Setting: 20
The 20 EMA helps identify the general market trend by smoothing out price fluctuations. - Key Observations:
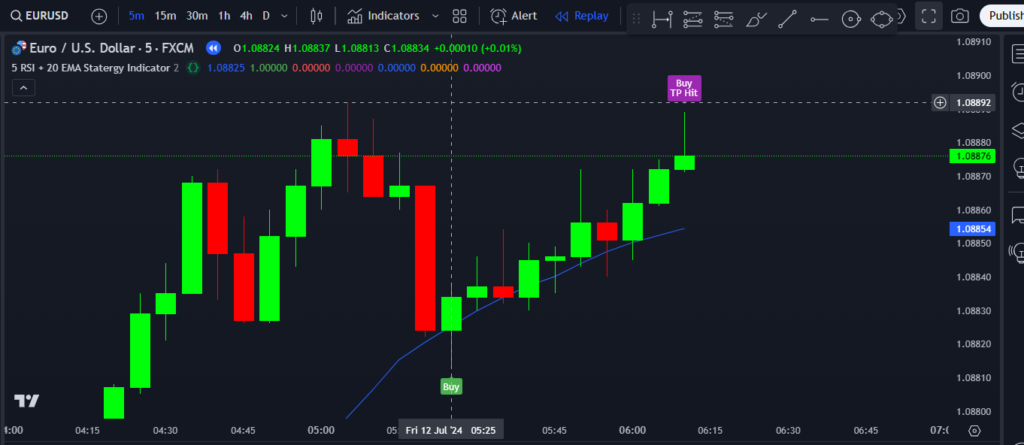
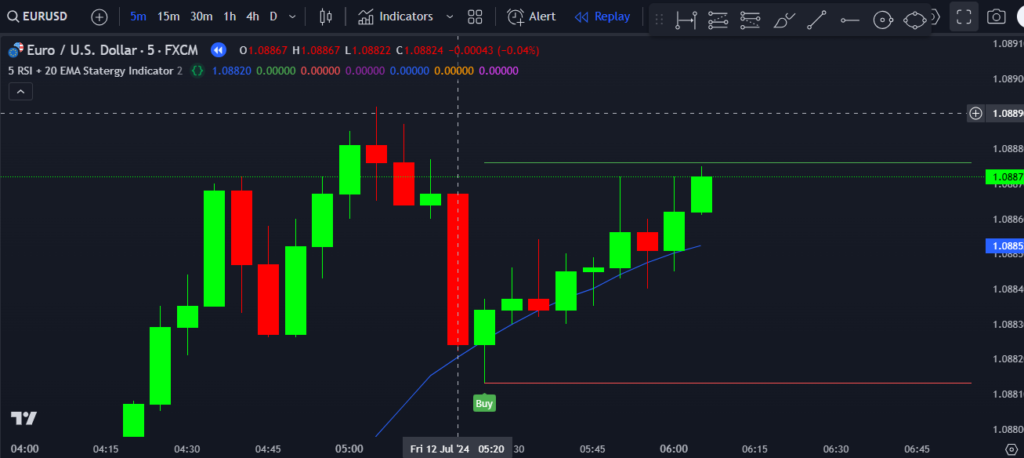
- Price moving above the 20 EMA indicates an uptrend, suggesting a potential buy opportunity.
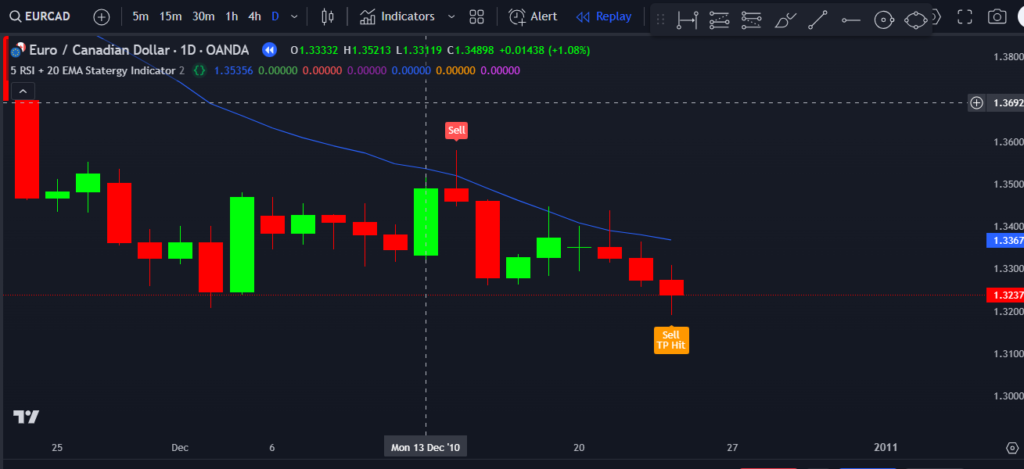
- Price moving below the 20 EMA signals a downtrend, where selling might be more prudent.
Strategy Overview:
- Look for the price’s relationship with the 20 EMA:
- If the price moves above the 20 EMA, consider a buy.
- If the price breaks below the 20 EMA or touches it before moving downward, consider a sell.
- Confirm with RSI:
- If RSI stays above 50, the market is bullish; buy signals gain strength.
- If RSI dips below 50, the market becomes bearish; selling signals are stronger.
- Stop-loss:
- Place a stop-loss at the high of the previous candle for added protection.
- Risk-Reward Ratio:
- Follow a 1:2 risk-reward ratio for disciplined trading.
Indicator Overview:
Why Combine RSI and EMA?
This combination blends the strengths of momentum analysis (RSI) with trend identification (EMA). It reduces noise and offers clear signals for entry and exit points.
Key Benefits:
- Simplicity: The strategy is easy to understand and implement, making it suitable for beginners and seasoned traders alike.
- High Sensitivity: A 5-length RSI reacts quickly to market changes, providing timely insights.
- Trend Confirmation: The 20 EMA confirms the market’s overall direction, enhancing the reliability of RSI signals.
How 5 RSI + 20 EMA Statergy Indicator Works on TradingView:
TradingView is an ideal platform for implementing the 5 RSI + 20 EMA Strategy, offering user-friendly tools and scripting capabilities through Pine Script. Here’s a step-by-step guide to set it up:
Step 1: Add Indicators
- Open the TradingView chart.
- Select the daily time frame from the top toolbar.
- Add the Relative Strength Index (RSI) indicator:
- Go to the “Indicators” menu.
- Search for “RSI” and adjust its length to 5 in the settings.
- Add the Exponential Moving Average (EMA):
- Search for “Moving Average Exponential.”
- Set its length to 20 in the settings.
Step 2: Identify Signals
- Bullish Signal (Buy):
- Check if the price is moving above the 20 EMA.
- Confirm if RSI is above 50.
- Bearish Signal (Sell):
- Look for the price breaking below or touching the 20 EMA and moving downward.
- Confirm if RSI is below 50.
Step 3: Test and Optimize
- Use TradingView’s strategy tester to backtest the strategy.
- Optimize parameters like the RSI length and EMA period based on your trading goals.
Advantages of Using TradingView for This Strategy:
- Customizability:
TradingView allows precise customization of indicators and settings to fit individual preferences. - Pine Script Integration:
Automate strategies and refine them using Pine Script for backtesting and real-time alerts. - Real-Time Data:
Access live market data to execute the strategy effectively. - Community Insights:
Learn and share custom scripts with the TradingView community to improve the strategy.
Conclusion:
The 5 RSI + 20 EMA Strategy is a powerful tool for traders looking to capitalize on market momentum and trends. By combining the sensitivity of a short RSI length with the trend-following nature of the 20 EMA, this setup offers clear entry and exit signals. TradingView provides the perfect platform to implement, test, and refine this strategy with its robust tools and Pine Script capabilities. Embrace disciplined trading with this method, ensuring proper risk management and adherence to the 1:2 risk-reward ratio for consistent results.
Pinescript of 5 RSI + 20 EMA Statergy Indicator
Get in touch with us at +91 7620658346 to access this indicator. We provide custom algorithm development for TradingView, MT4/MT5, and trading bots.
Follow @algo_aakash on Instagram, YouTube, and Twitter for updates.
Disclaimer
The information provided in this article and any related indicators is for educational purposes only. Trading in financial markets involves substantial risk, and there is no guarantee of profit. 5 RSI + 20 EMA Statergy Indicator, which may not accurately predict future market trends. Users should conduct their own research, assess their risk tolerance, and consult with a licensed financial advisor before making any trading decisions. The author and developer of this indicator are not responsible for any losses incurred from its use. Please trade responsibly.

0 Comments